Mapping Water Flow of Mount Kilimanjaro
Return to SAGA Index Page.
Return to Main Index Page.
In this lab, we used the software SAGA to derive a terrain map from a digital elevation model of the Mount Kilimanjaro region to determine water flow. For my data, I accessed the Aster Digital Elevation Model version 3 from the NASA site EarthData.
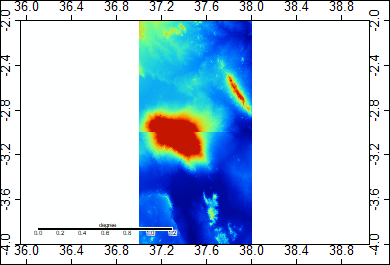
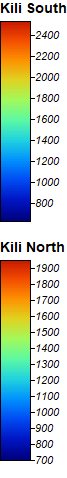
The data I downloaded contained two separate zones as defined by Aster. Each zone map contains a color gradient which represents elevation. As you can see, when I attached the two zones together into a single map, there is a clear boundary between the two zones. This is because the highest point of reference within each zone is different, and as such the same color in each zone is associated with a different elevation value.
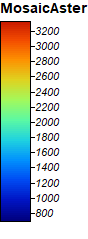
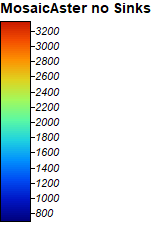
To amend this discrepancy, I performed the mosaic tool to standardize the two zonal maps as a single map. Now, the values of each gradient of color is consistent throughout the map. For this function, I also set the geographic parameters to a more contained area focused on the mountain, that way further procedures only focus on our area of concern and don’t spend excess amounts of time computing data beyond Mountain Kilimanjaro. With this map, I reprojected the coordinate system to Transverse Mercator (UTM) which is a more accurate projection for linear measurements. I named this elevation data set MosaicAster.

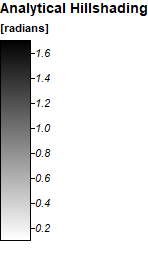
I next performed the analytical hillshading tool on MosaicAster. 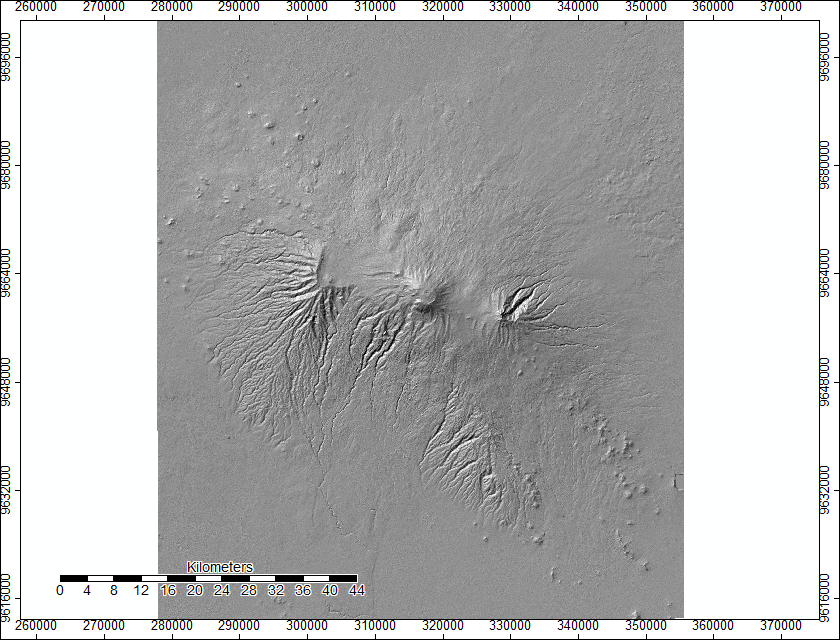
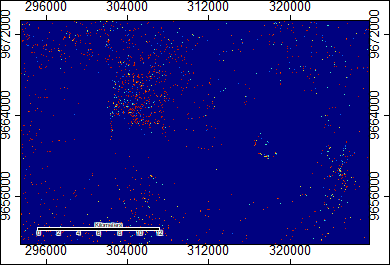
In order to determine the flow of water from Mount Kilimanjaro, sink locations must be removed. These are locations were water is captured and ceases to flow downstream. Though, before the sinks can be filled in MosaicAster, first they must be determined with the tool Sink Drainage Route Detection. This tool creates an output of which direction water should flow when it encounters a sink.
Then, I performed the Sink Removal tool to adjust the MosaicAster to have the calculated sinks filled.
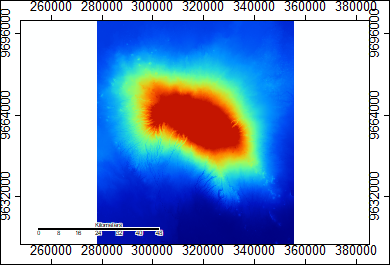
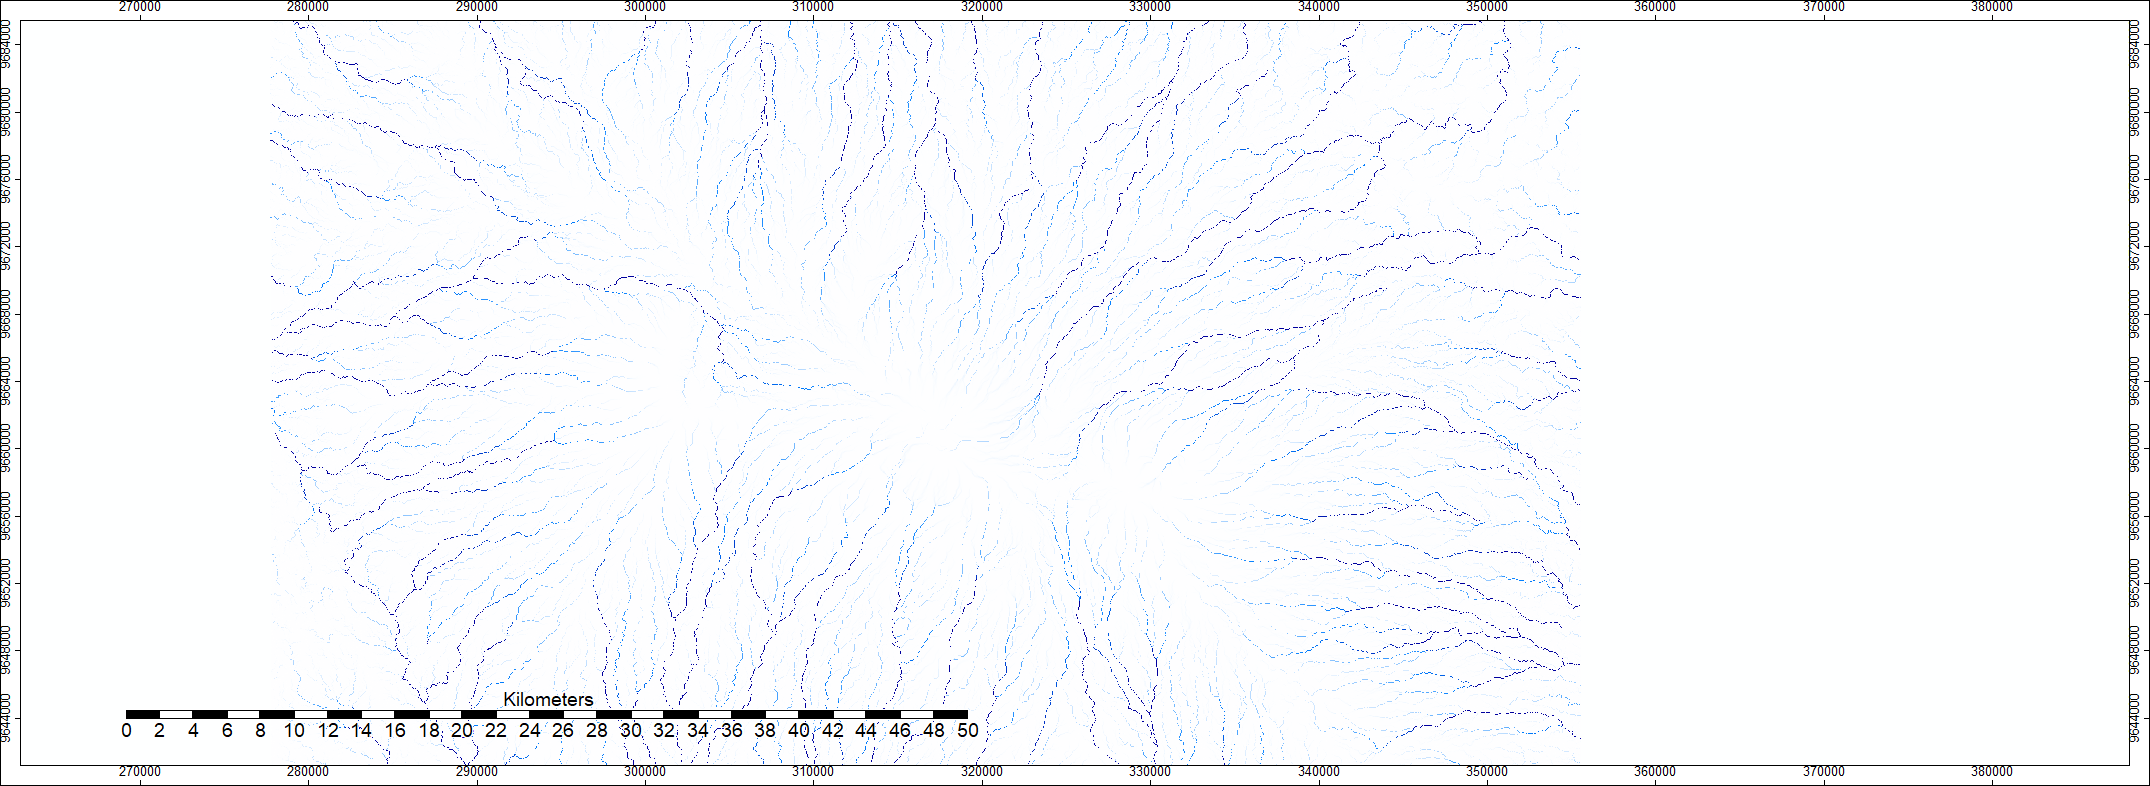
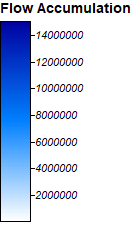
With sinks filled, I calculated flow accumulation. The output demonstrates how many cells flow into another cell. As such, the higher the value and darker the shade of blue in the figure, the higher amount of other cells there are that flow into that valued cell. Cells in which no other cells flow into it are valued as 1 and appear as white on the figure.
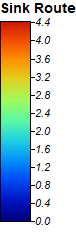
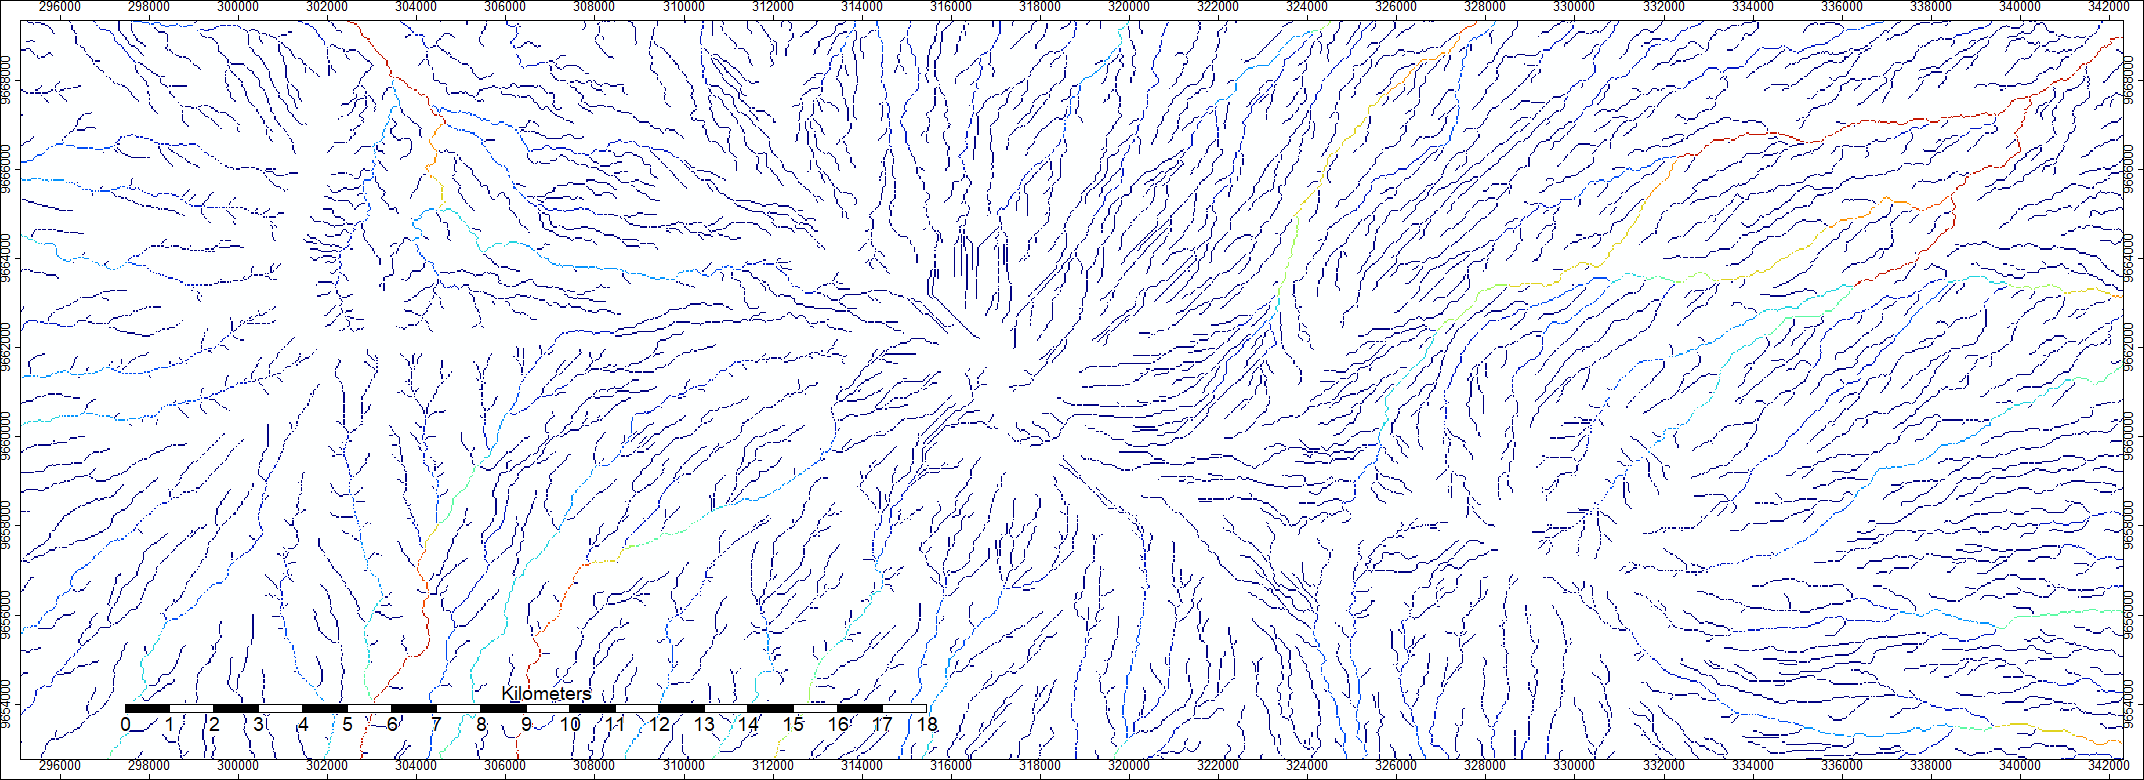
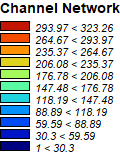
In the final tool I used, Channel Network, I created an output that displays the streams and rivers that flow from Mt Kilimanjaro with a value of how much flow they receive from surroundings cells. On the map, blue water networks represent the smallest catchment whereas red represent the largest rivers.
Return to SAGA Index Page.
Return to Main Index Page.