Return to QGIS and PostGIS Index Page.
Return to Main Index Page.
First QGIS Model
In this week’s lab, I created a model to calculate the distance, degree of orientation, and direction of a city’s census tracts from a single point. I then used this model in the example of Chicago. To download the model, click here.
Workflow of Model
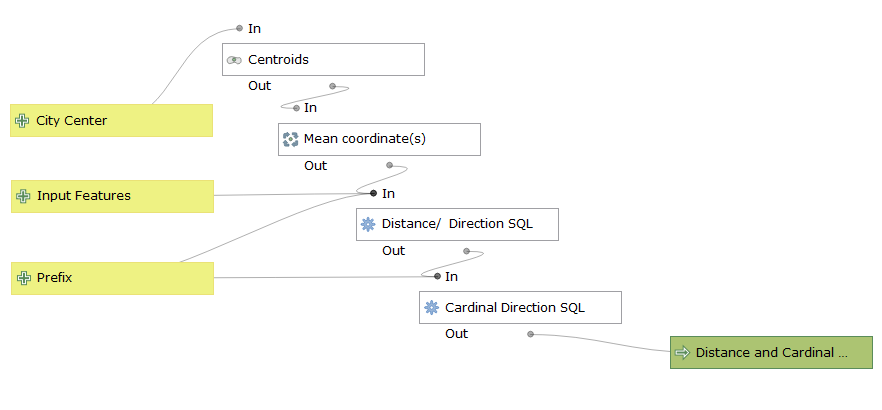
To perform this model, you will need two different input layers: City Center and Input Features.
The City Center input can be either a point or multipolygon feature. The Input Features must be have a multipolygon geometry, such as a census tracts layer. The layer that you input as the City Center is what you designate as that central point to calculate distance, degrees, and direction of the multipolygons of the Input Features layer from.
Don’t worry about what coordinate system to upload your layers as! The step titled Distance/ Direction SQL automatically transforms whichever input coordinate system(s) you have into a reasonable one for the function at hand. For the measurement of direction from the City Center to Input Features, the calculation is performed in EPSG: 4326. As for the calculation of degrees between these two layers, the function is transformed into EPSG: 3395, which is more robust for measuring degrees.
The final outcome has three new columns in the attribute table not found in either original input: distance calculation; degree of orientation measurement; interpretation of degrees into cardinal direction. In the parameter section of the model, you will be able to add a prefix to appear in these three columns. The default is ‘cbd’, short for Center Business District. After the model, if you used census tracts as your Input Features, this layer will possibly have census demographic and housing cost data attached to the layer. With these three output columns, you will be able to examine a number of different spatial distributions of demographic concentrations as reported by the census.
I originally attempted to use the Field Calculator function in the model builder to perform the model’s main functions, but upon revisions I decided to rely upon SQL for the whole model after repeated issues with Field Calculator’s ability to execute a transform function.
Model Example in Chicago
In this example, I relied upon census tracts from the 2010 Census. Upon a suggestion by my lab instructor of where the center business district of Chicago is located, I selected three census tracts to export as a layer and input as my City Centers layer. Visit this page for a second example of this model and how I used a polar plot and scatter plot to demonstrate the data for Burlington, VT.
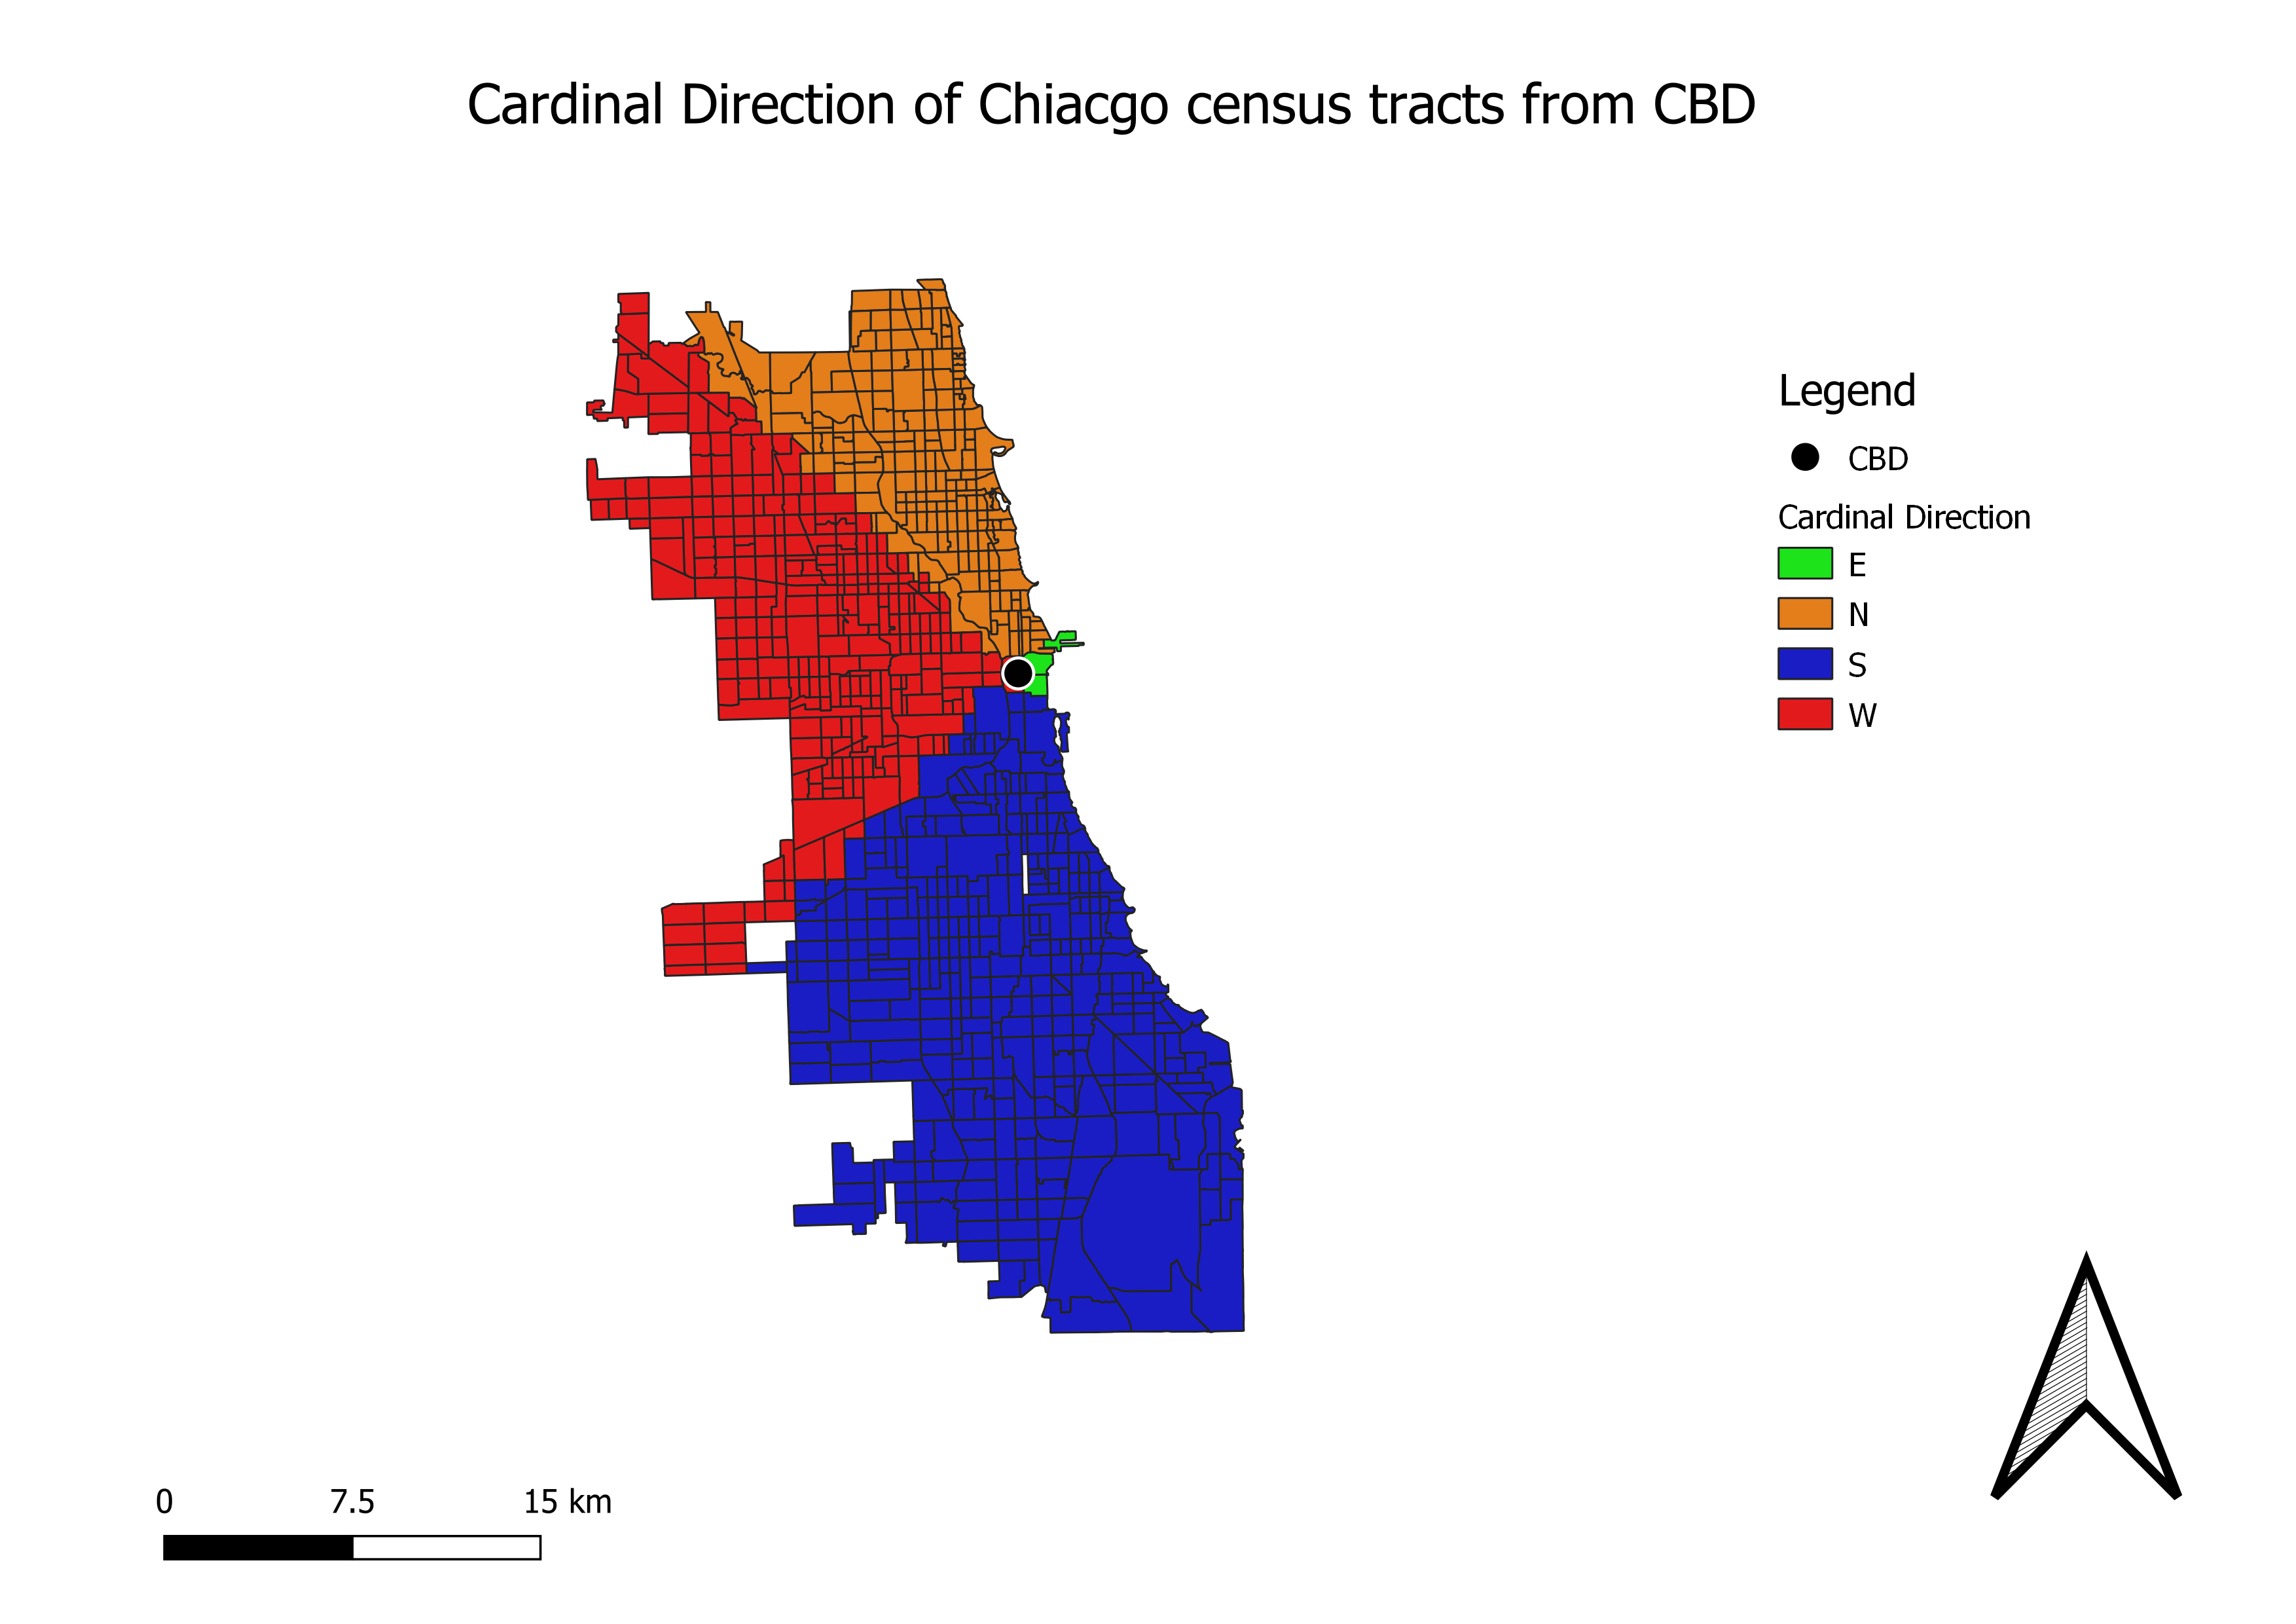
The map above is a categorized classification of the cardinal direction that census tracts are from the center business district.
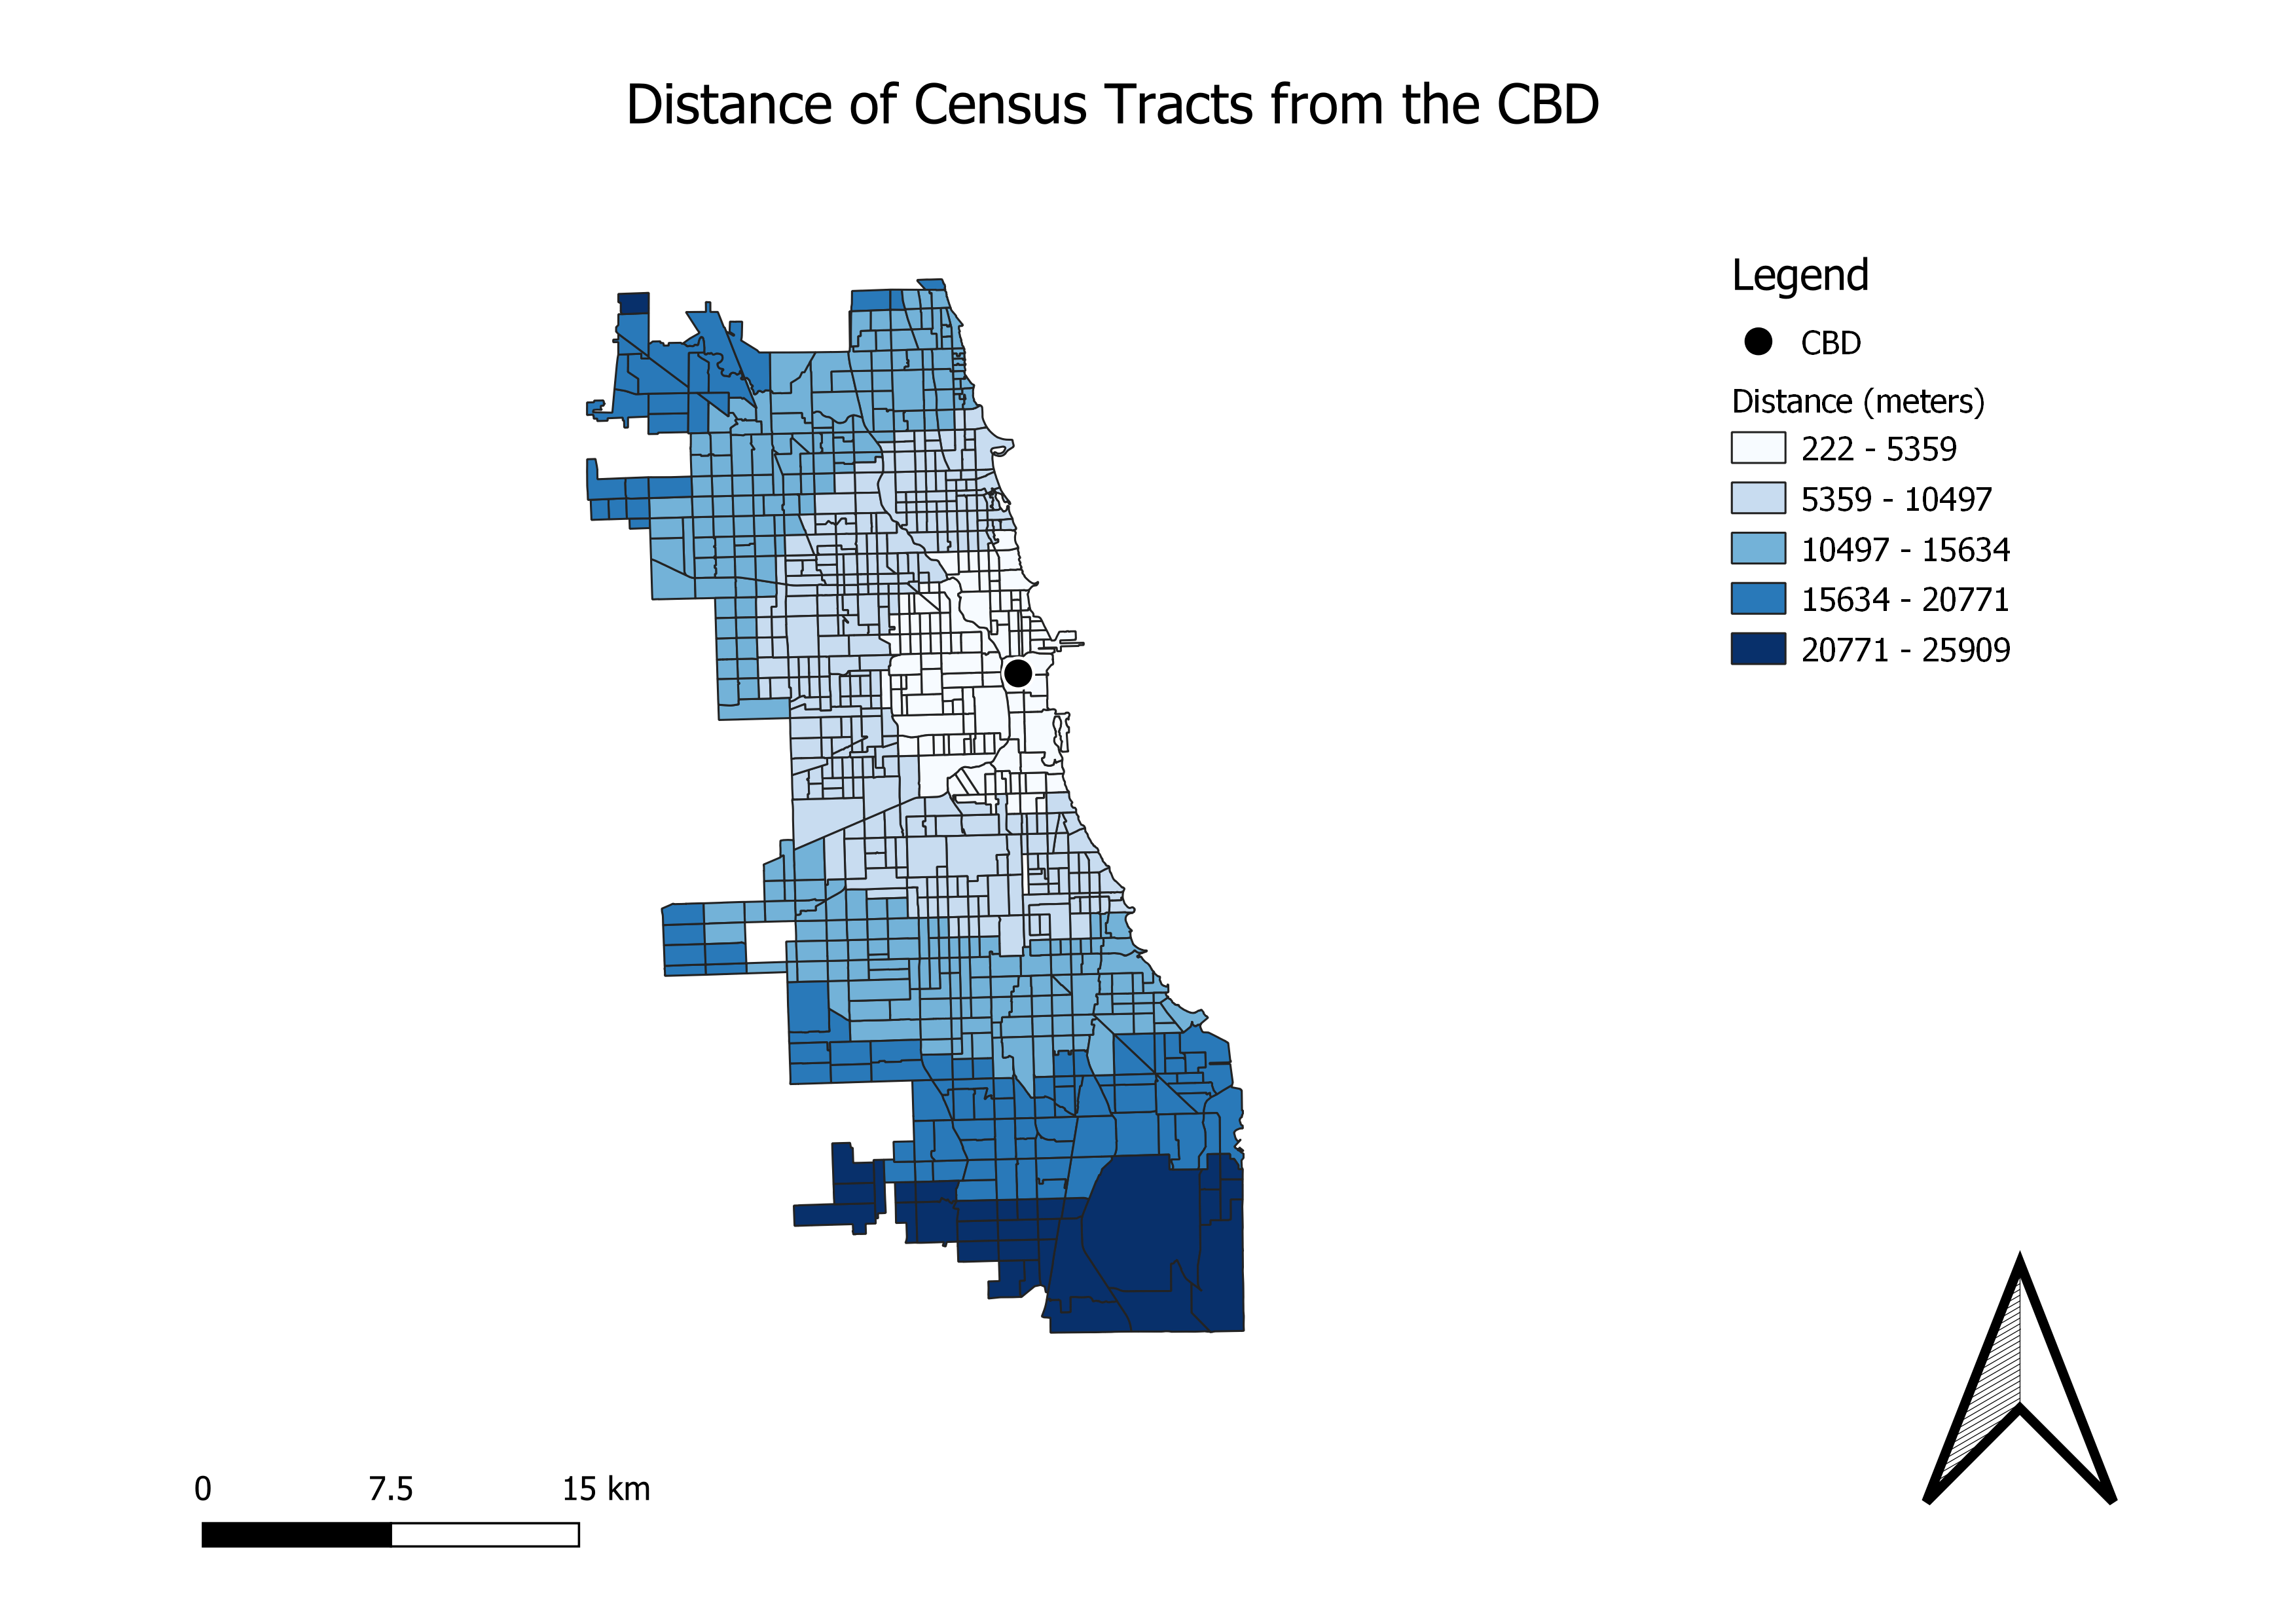
The map above is a gradual classification of tract distance from the center business district.
Return to QGIS and PostGIS Index Page.
Return to Main Index Page.