Return to QGIS and PostGIS Index Page.
Return to Main Index Page.
Analysis of Rent Prices in the Greater Burlington, VT Urban Area
In this lab, I used a model that I previously developed which calculates the distance and direction of census tracts from a chosen point. For a narration of the model’s workflow and functions, check out this previous page.
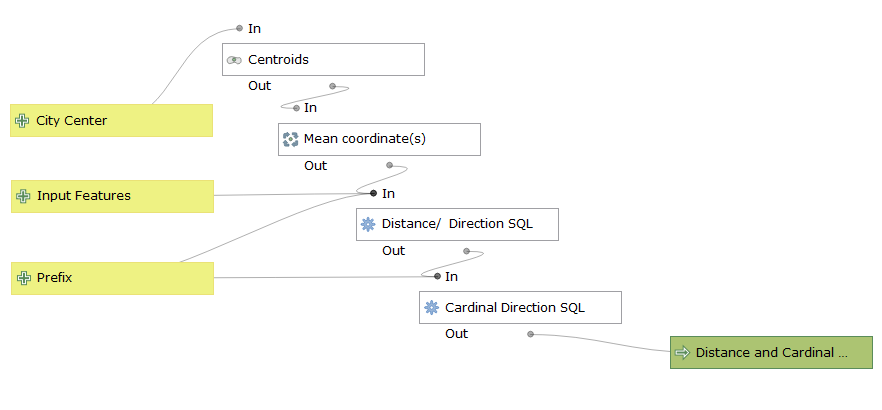
With this model, I made a distance plot and direction plot of Burlington, VT urban area rent prices. The distance plot displays how median monthly rent prices change at different distances from the city center and the direction plot displays monthly rental prices in terms of the direction that the region is from the city center. The purpose of this is to determine if there are any spatial trends, either with direction or distance from the city center, which affect rental prices in the city.
Data Sources
I downloaded my 2010 census tract shapefile for Vermont from the Vermont Open Geodata Portal. This dataset is a TIGER/Line shapefile developed by the US Census. The data as accessed from the Vermont website already includes demographic data attached onto the census tracts, but does not have median monthly rent data. I downloaded my rent data from the US Census American FactFinder database page. I searched for the median gross rent of census tracts, but selected to only consider tracts defined as urban within the greater Burlington area as defined by the US Census. Additionally, I relied upon Google Maps to determine my city center location.
To download my data sources: Census Tracts; Rent Data.
For this lab, I used QGIS to run the model and prepare the data prior to model. After the model, I used the Data Plotly plugin in QGIS to develop a scatterplot and polar plot.
Steps Before Model
In order to use my model, I prepared my data to only consider the census tracts that consist of the Burlington urban area, attached the tract rent data to that layer, and created a new layer which represents the city center. First, I joined the rental data to the census tracts. Each dataset had a join column corresponding to the census tract that I used to facilitate the join. Then, in the census tract table I selected all of the tracts that contain the new rent data and extracted a new layer. This created a layer of just the census tracts of the Burlington urban area with attached rent information, which I used as one of the two model inputs. As for the second input, the downtown layer, I chose to consider Church St as the central business district of the city as it is a central commercial hub. I then typed “Church St Burlington, VT” into Google Maps and then copied the coordinates into an Excel file that I saved as a csv. In QGIS, I selected Layer -> Add Layer -> Add Delimited Text Layer and then selected my csv file and defined the x and y attributes and projection type, which in the end won’t matter since the model transforms the inputs into a set projection type. This point is good enough to act as the city center input in the model, but I chose to select the census tract the point coincided with to be my city center so I could display the tract as I did in the maps below. To do this, I simply selected the tract then extracted selected attributes as a new layer. I then plugged my layers into the model.
Results
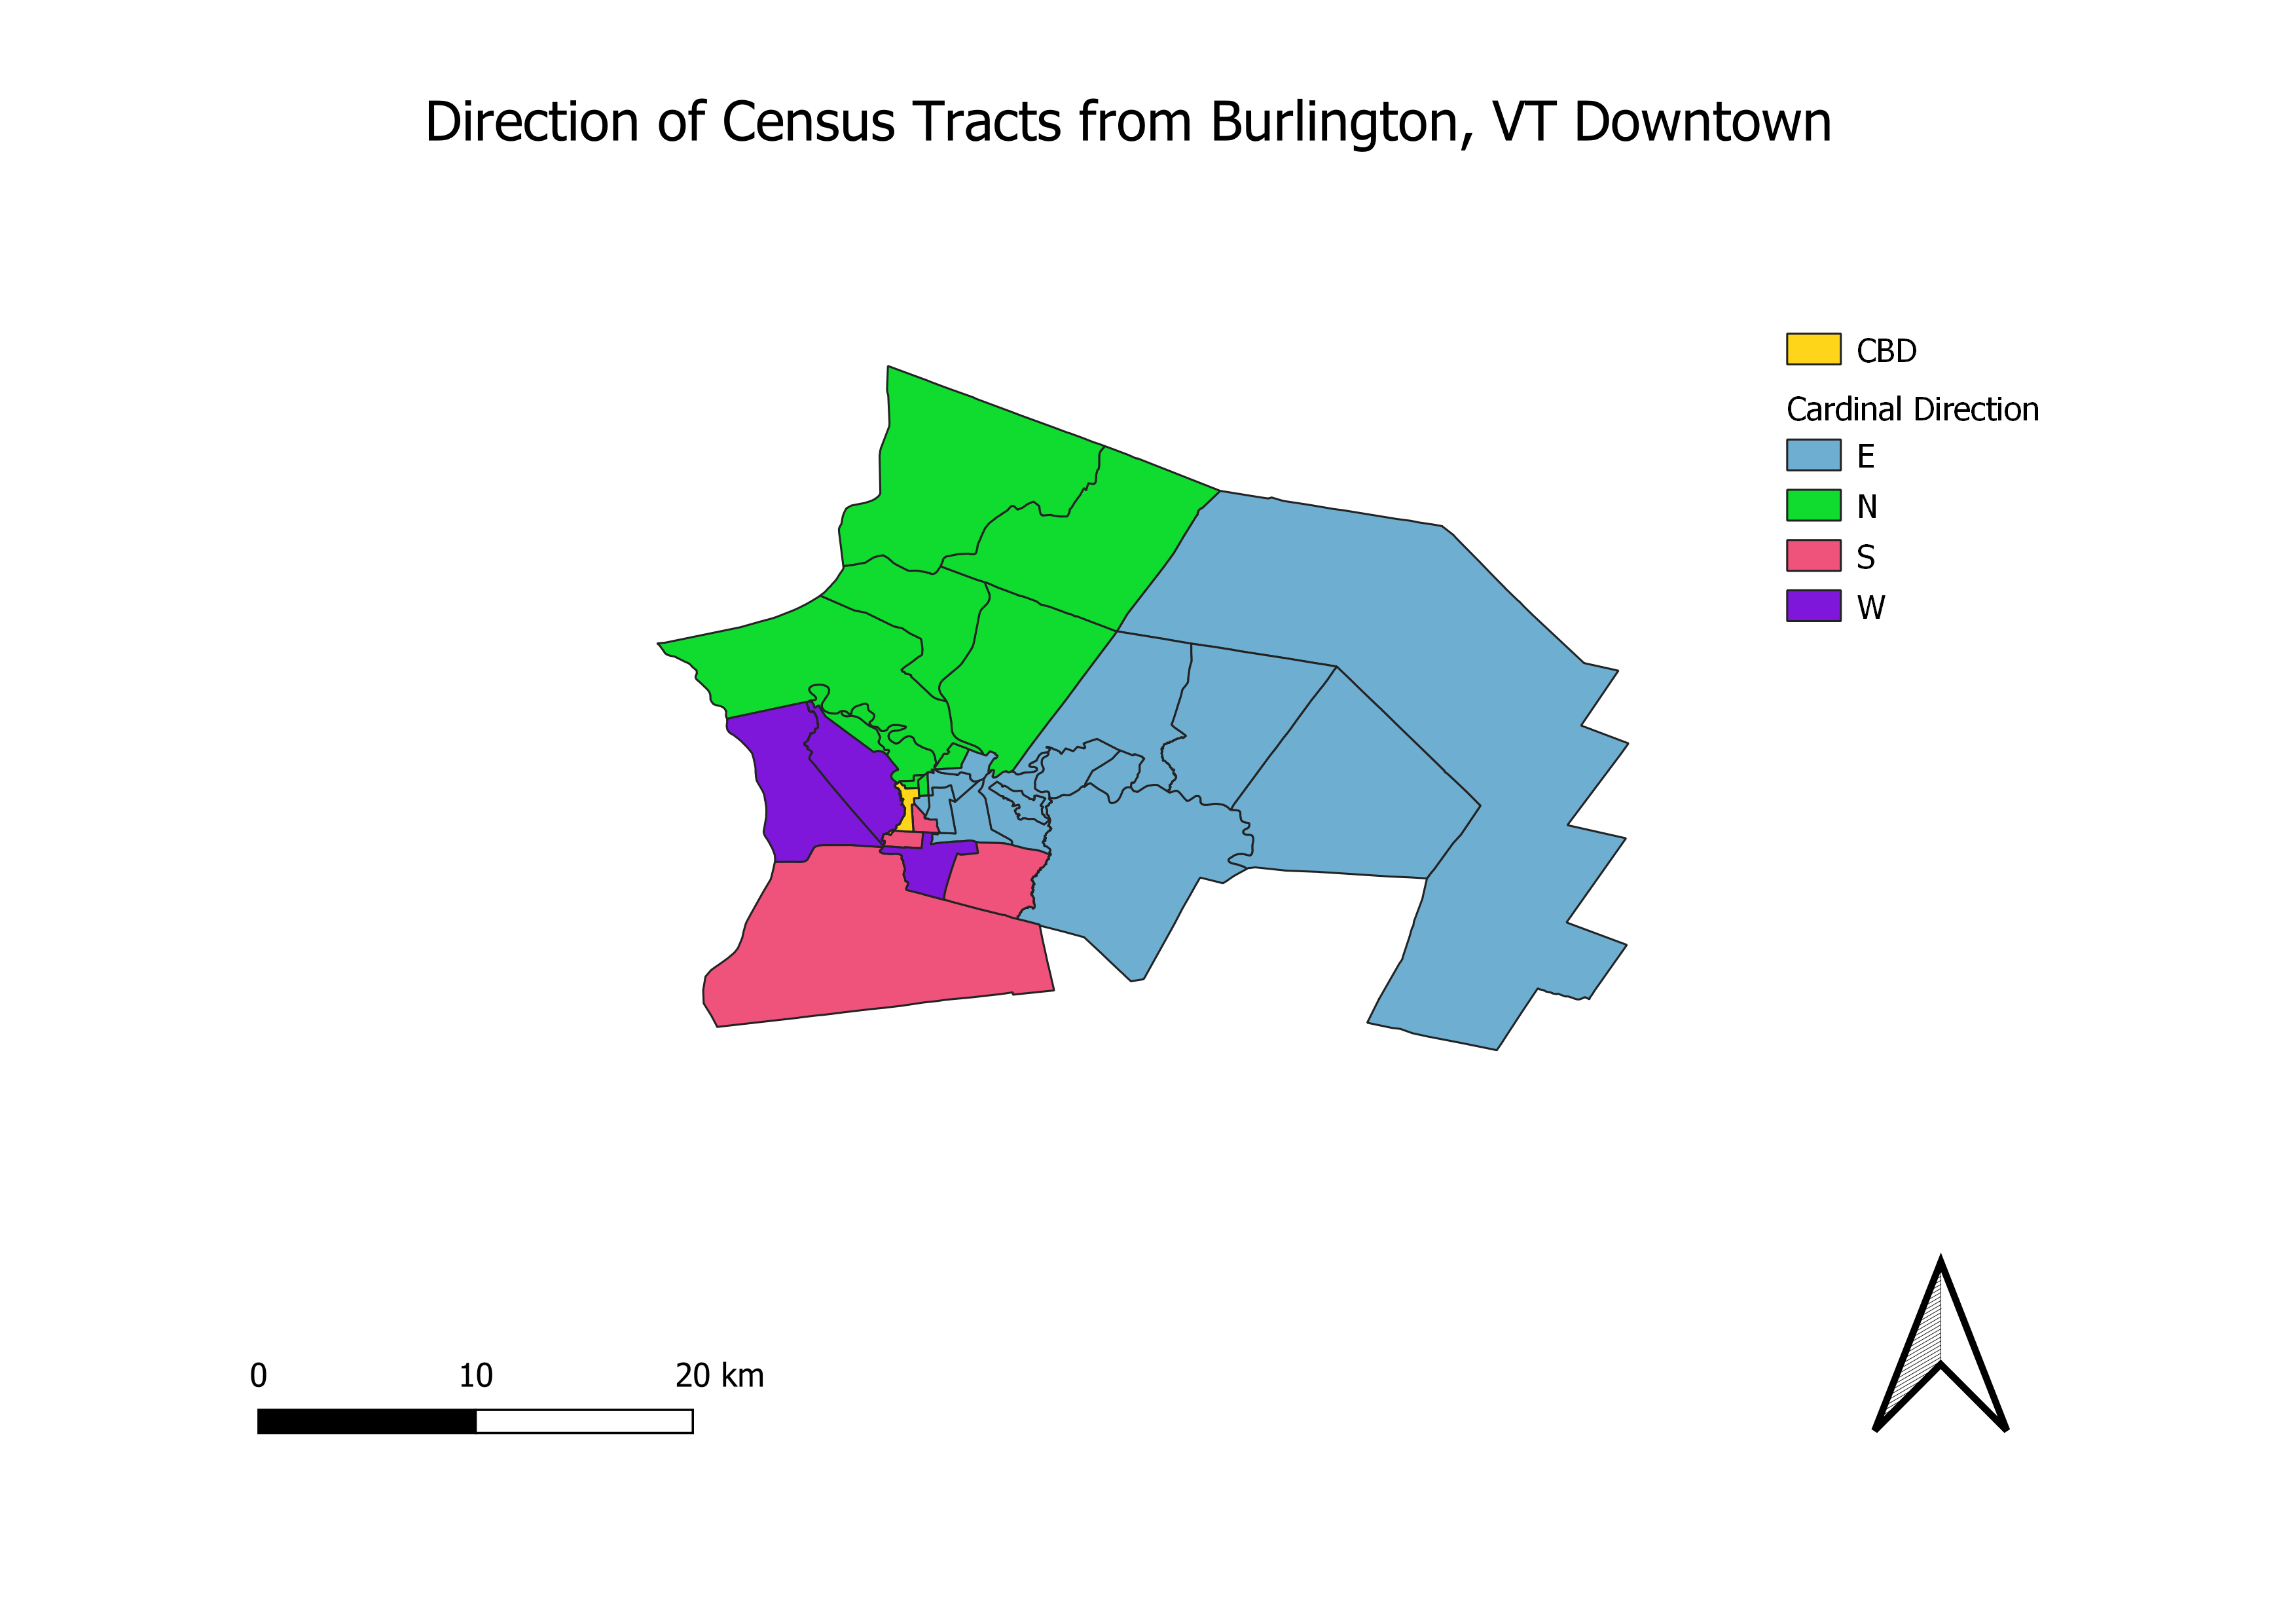
This map below represents the direction of Burlington’s census tracts from the city center.
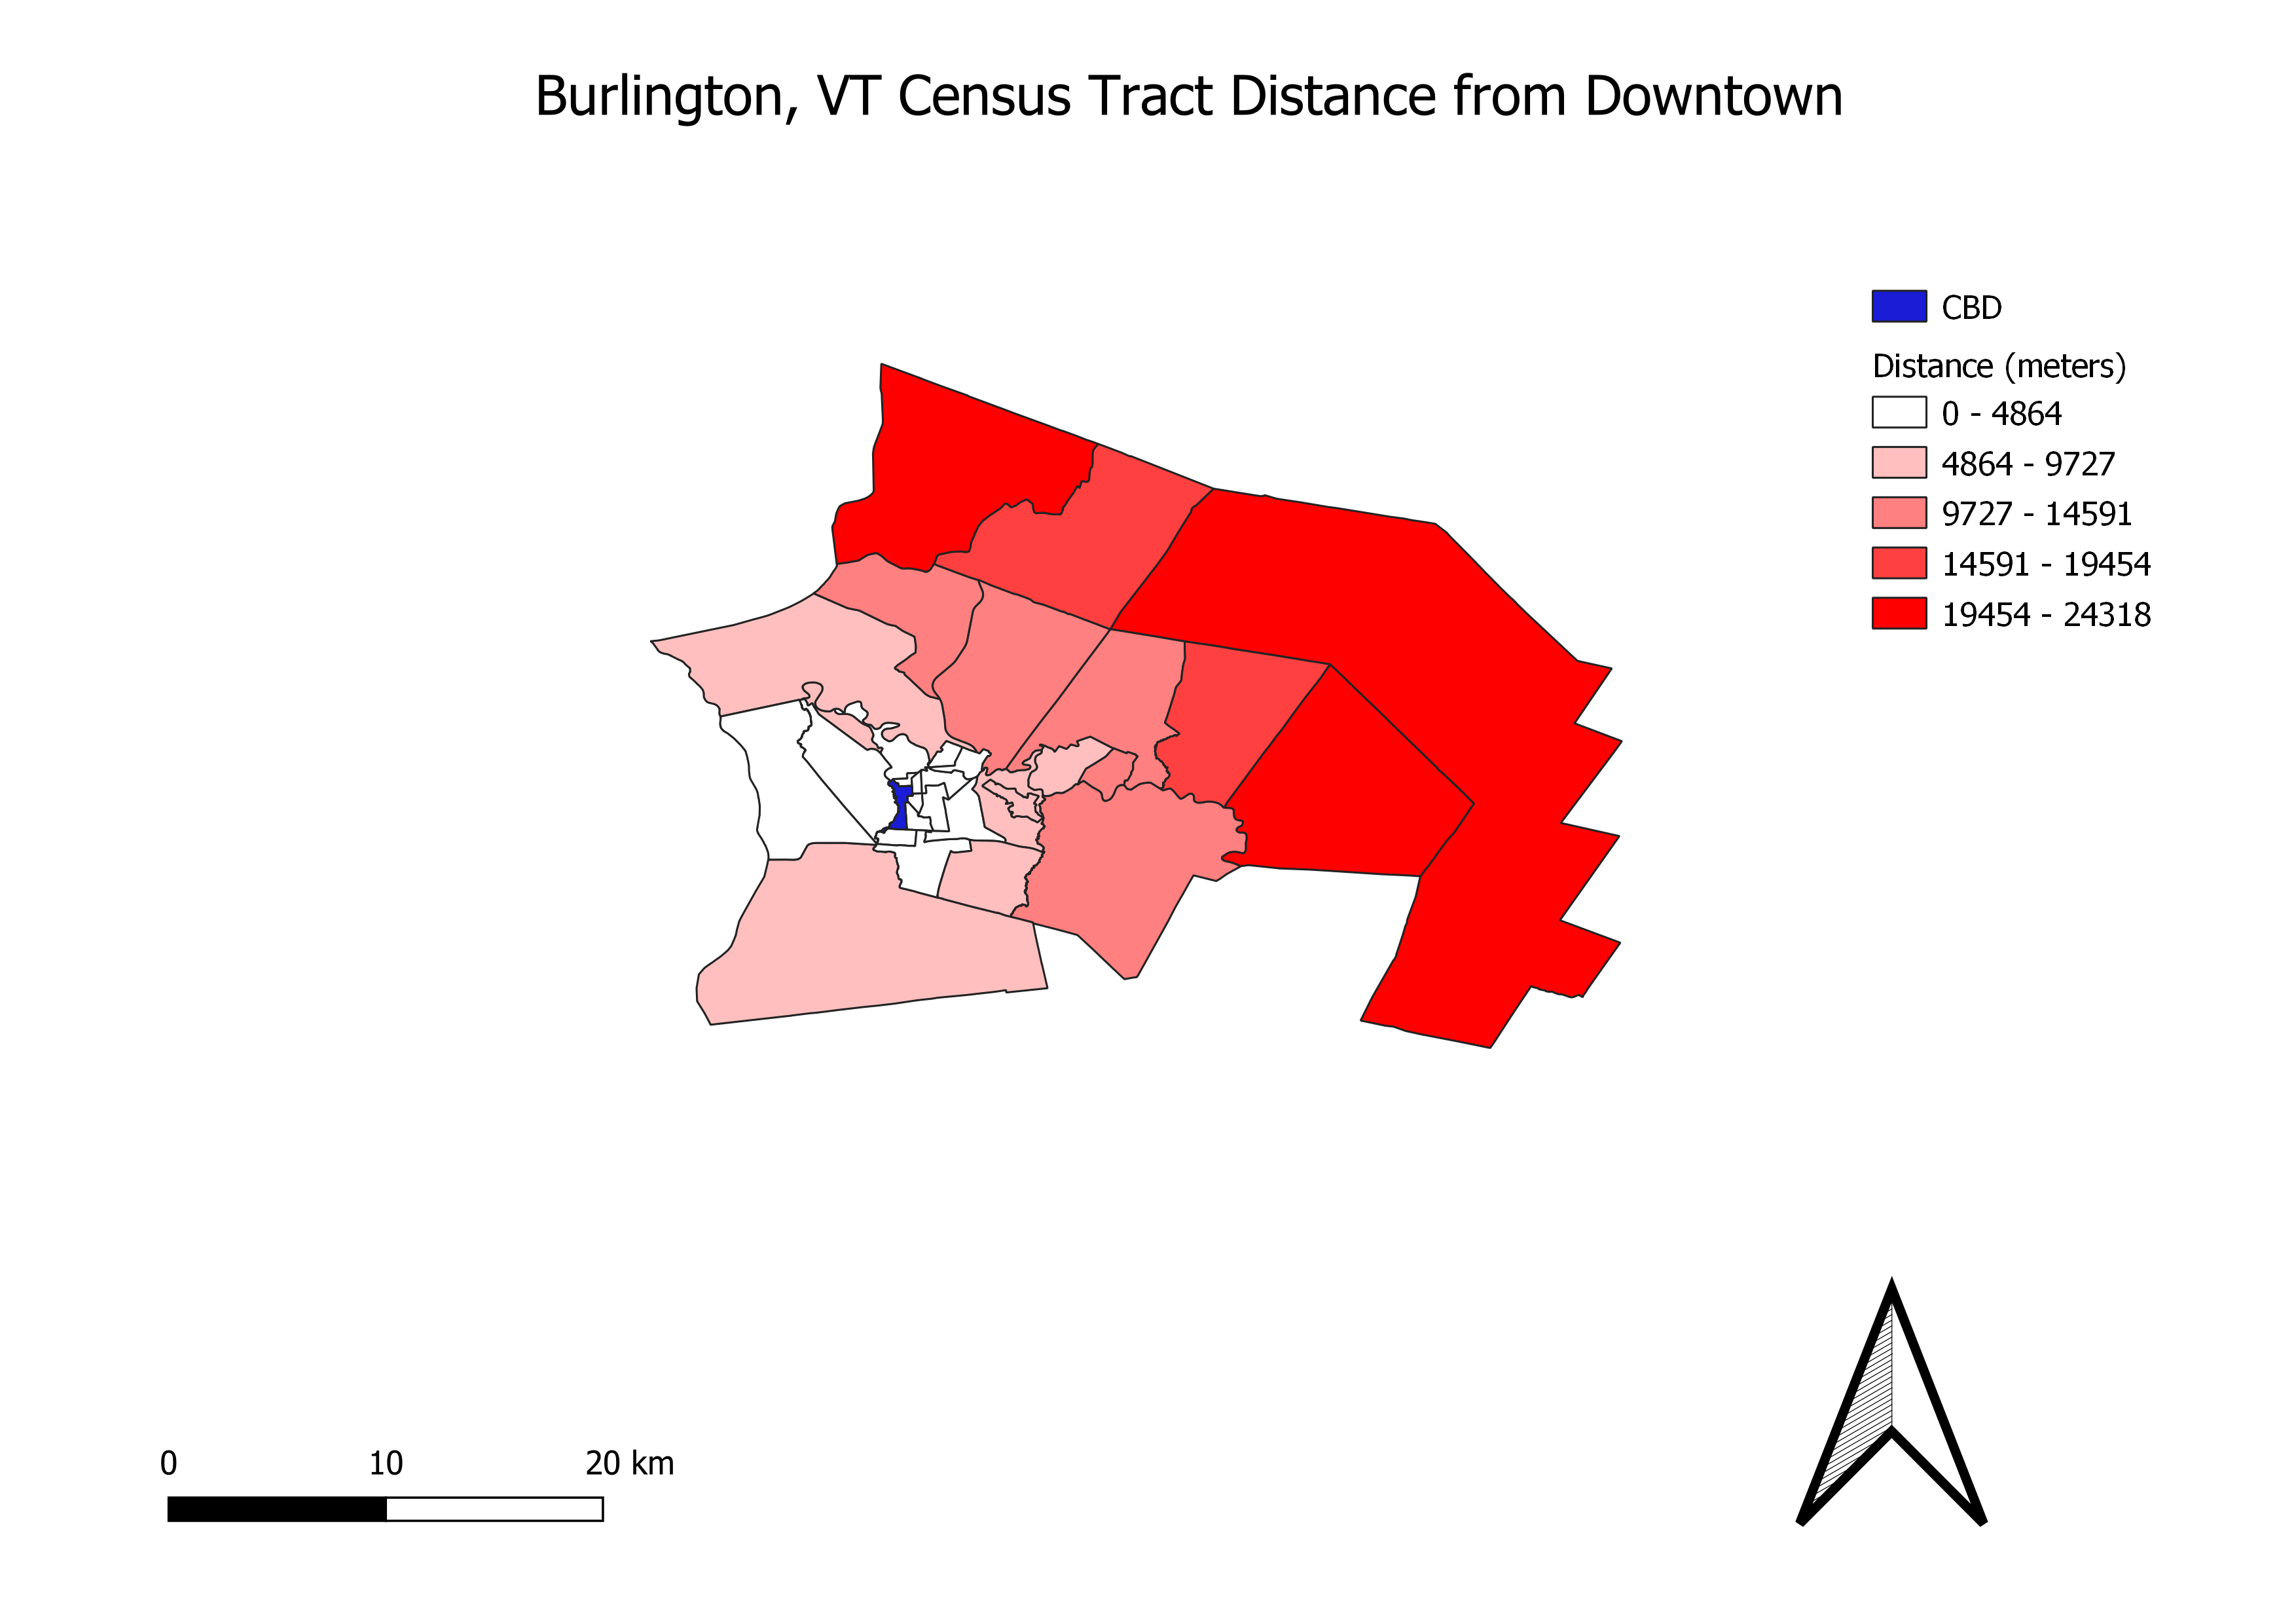
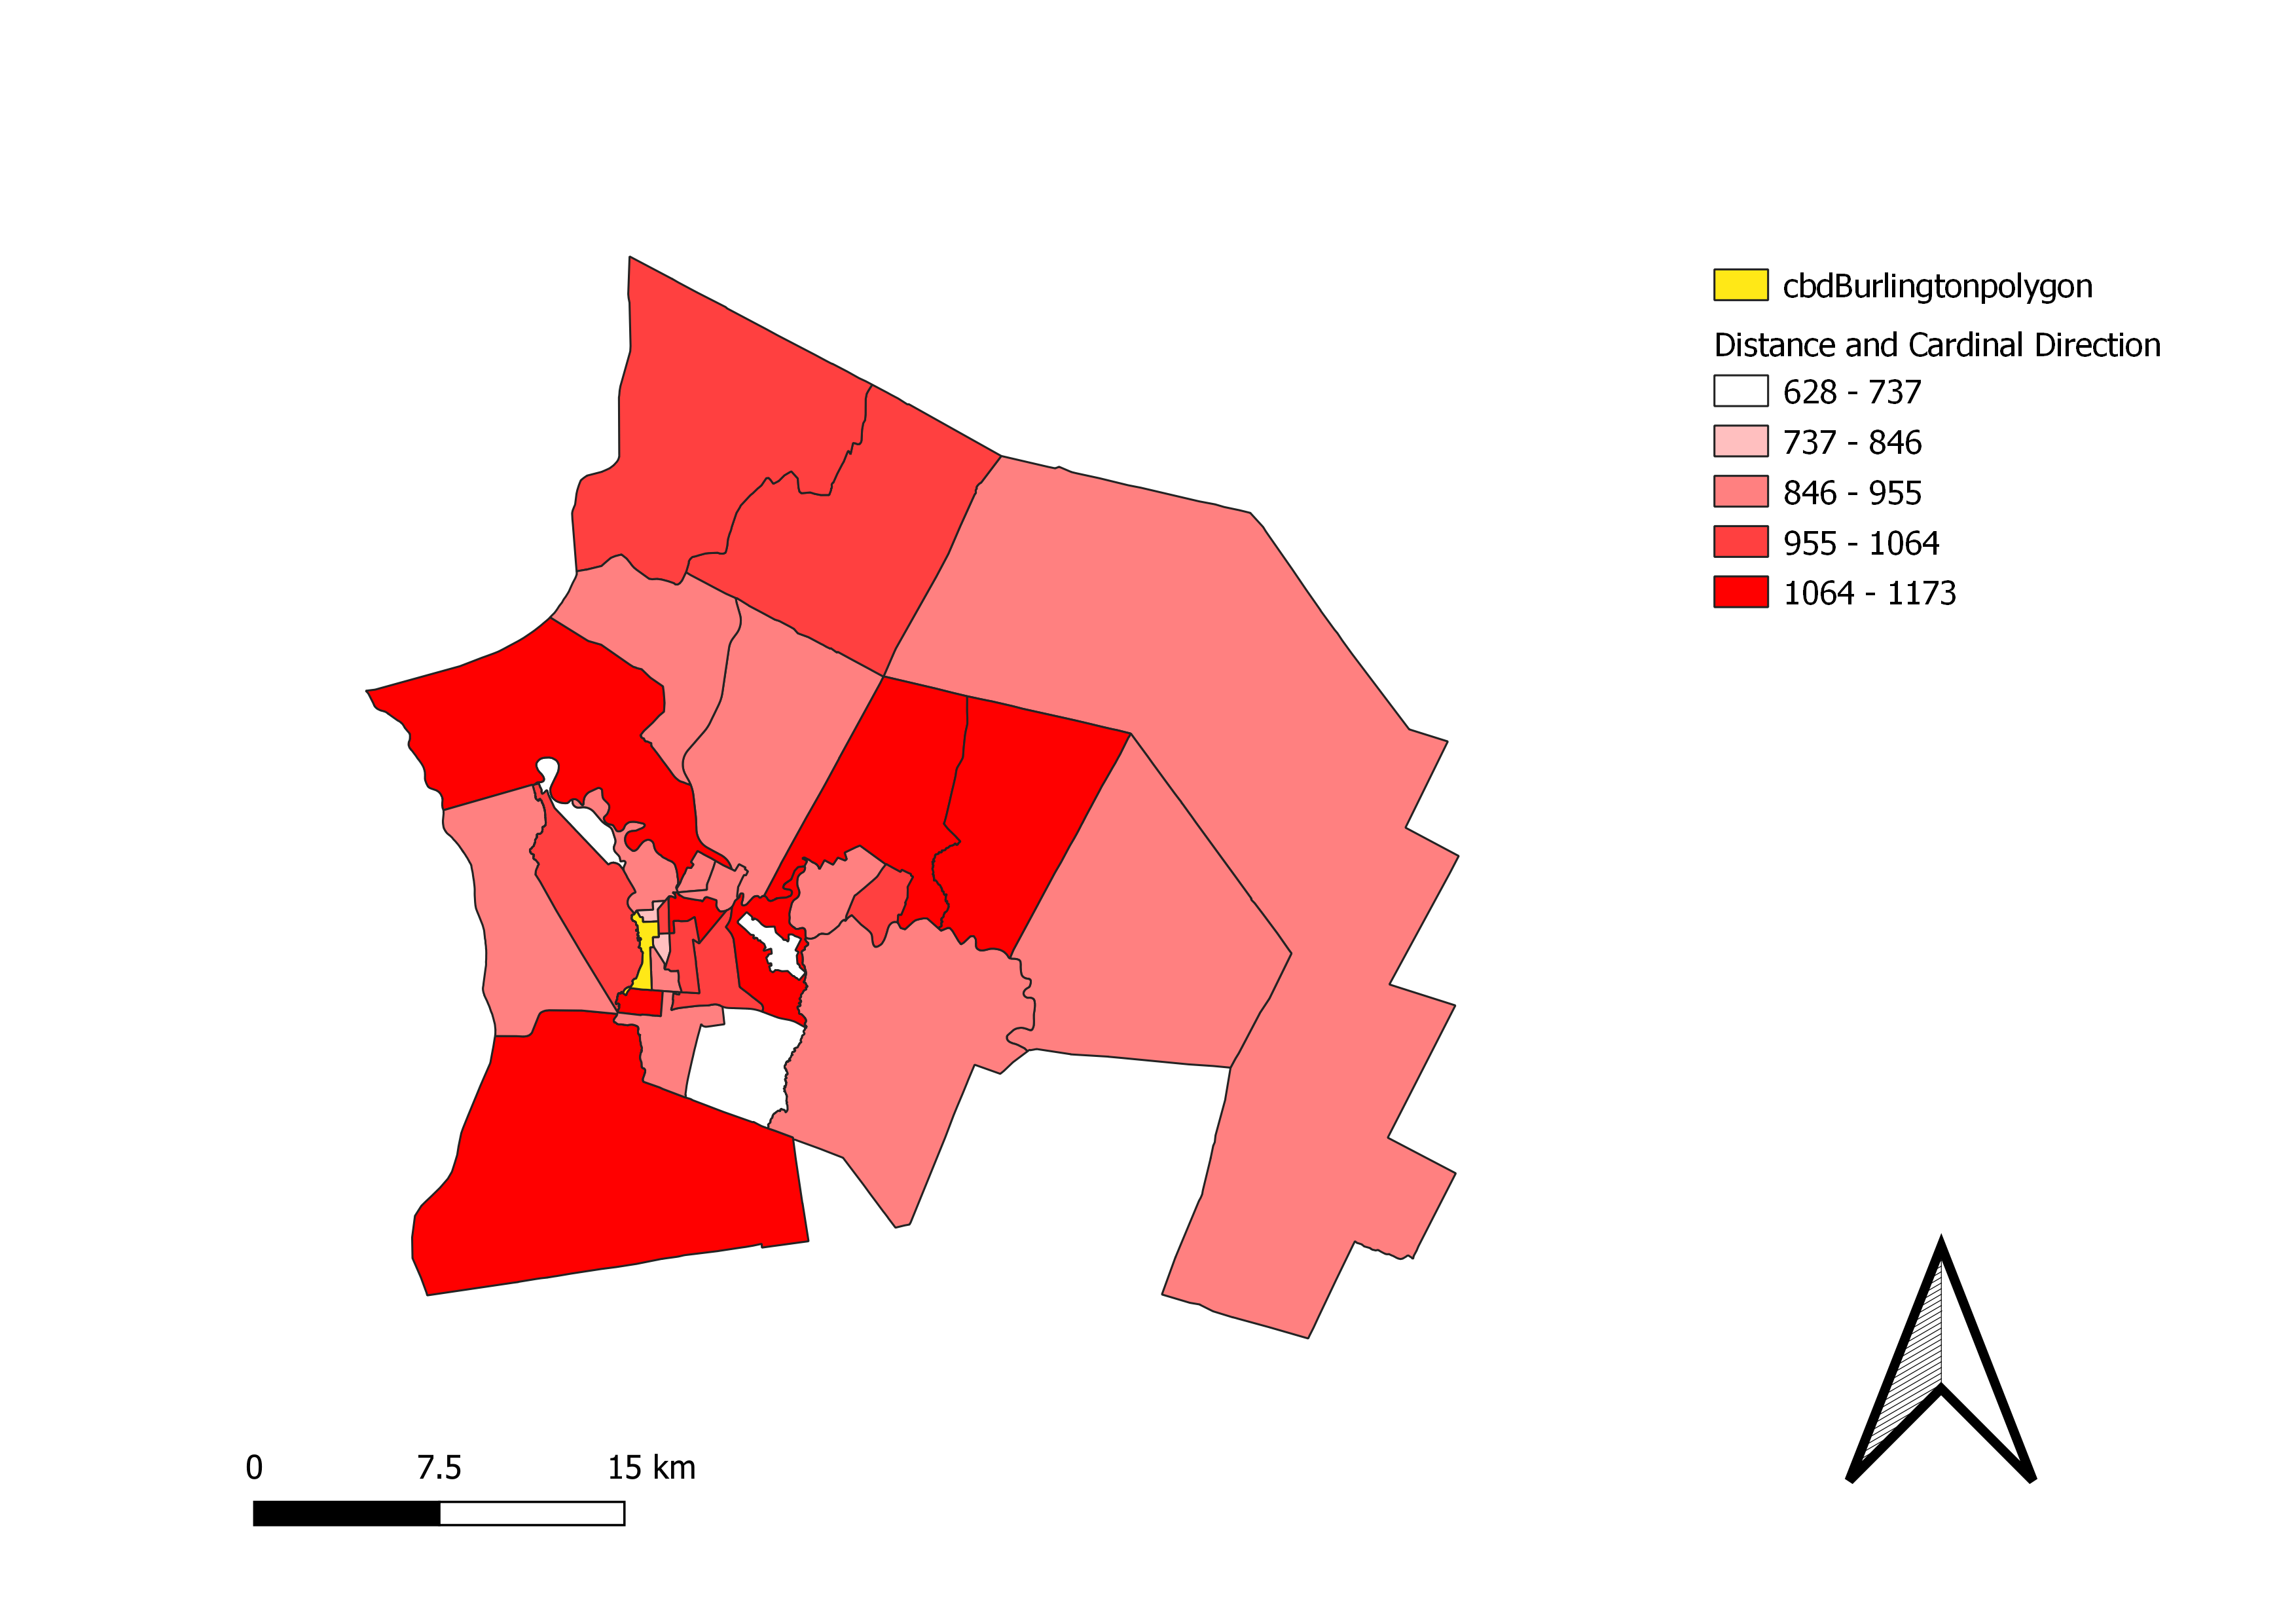
The map below displays the distance of census tracts from the city center.
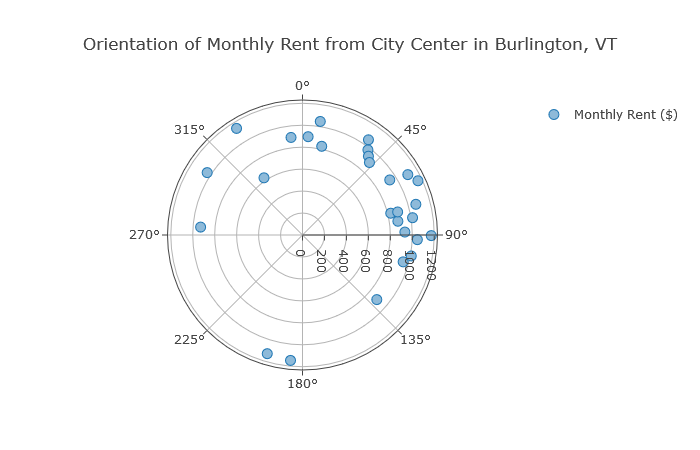
The following polarplot represents the median monthly rental cost of Burlington’s census tracts displayed over that tract’s orientation from downtown.
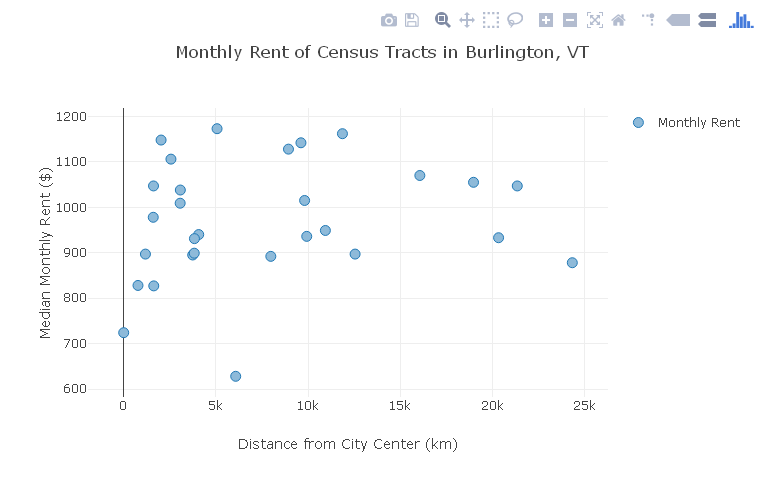
The following scatterplot displays census tract median monthly rental cost over that tract’s distance from downtown.
This map displays the median monthly rental cost of each Burlington census tract. Note the three white census tracts in the map. The largest and most southern of them is a tract that does not contain rental data, possibly the result of a data gap. The tract nearest to the largest gap is an airport and as such does not contain houses and rental data. The third and most northern census that’s white on the map is because its rental values fall within the white shade of the legend.
Conclusion
All of these graphics demonstrate that there is not a strong correlation of direction or distance from the city center to rental cost in Burlington, VT. Though, with this model it is easy to see if a pattern emerges in other cities throughout the country. Since census shapefiles and data is openly available for the public, this model can be used on any city. Further, there are a number of open-source plugins in QGIS that can be used to display graphics of the results from analyses in a variety of manners.
Return to QGIS and PostGIS Index Page.
Return to Main Index Page.