Measuring Uncerntainty
A Comparison of ASTER and SRTM Digital Elevation Models
Return to SAGA Index Page.
Return to Main Index Page.
Introduction
After an introduction into the analyses of Digital Elevation Models in this previous lab, I sought to contrast the differences which result from two different DEM data sources. In this lab, I performed two hydrology analysis batch scripts of the region around Mount Uludag, Turkey. For each of these batch scripts, the steps of analysis were exactly the same. The only difference between the two scripts is that the sources of the initial elevation input were different. I conducted one batch script with ASTER elevation data as the initial elevation input and a second script with SRTM data, each of which are satellites which develop elevation models of the Earth’s surface. After the completion of the script, I analyzed differences in the predicted channel network outputs and attempted to explain the presence of uncertainty and error. My output is a map of channel network with commentary directly on the map.
For this hydrology analysis, I conducted one analysis with ASTER data as the initial elevation data and a second analysis with SRTM as the initial input. With each, I performed the analysis with Saga tools in the Windows Command Prompt. Each map displayed contains commentary written on the map to explain what is visualized. Further, the layers that each satellite mission gathered information from is considered in an attempt to explain patterns in elevation error that is manifested in the hydrology analysis process.
Data Sources and Platforms
I acquired both my ASTER and SRTM digital elevation data from the NASA operated site EarthData. For my batch script, I used SAGA and accessed the online tool documentation to determine how to structure the syntax of my batch processing steps. I developed my batch scripts on Notepad2 and executed them with Windows Command Prompt.
For my ASTER data, the spatial extent of my analysis consisted of the following granules: ASTGTMV003_N39E029; ASTGTMV003_N40E029.
For my SRTM data, I used the following granules: N39E029_SRTMGL3; N40E029_SRTMGL3.
You can search each of these granule codes in the data search page of EarthData to download them.
Methodology
Below is the batch script I used. This example is specifically for the ASTER data I used, but the only difference between this and the SRTM batch script is which files I linked as the inputs.
:: Developed by Ian8VT

::set the path to your SAGA program
SET PATH=%PATH%;c:\saga6

::set the prefix to use for all names and outputs
SET pre=ASTERdem

::set the directory in which you want to save ouputs. In the example below, part of the directory name is the prefix you entered above
SET od=W:\lab3\data\num\aster_dem_mosaic

:: the following creates the output directory if it doesn't exist already
if not exist %od% mkdir %od%

:: Mosaicking tool - combines the two elevation grids into a single one
saga_cmd grid_tools 3 -GRIDS=ASTGTMV003_N39E029_dem.sgrd;ASTGTMV003_N40E029_dem.sgrd -NAME=%pre%Mosaic -TYPE=9 -RESAMPLING=0 -OVERLAP=1 -MATCH=0 -TARGET_OUT_GRID=%od%\%pre%mosaic.sgrd

:: UTM Pojection tool - reprojects the grid into the proper UTM code for this region in Turkey
saga_cmd pj_proj4 24 -SOURCE=%od%\%pre%mosaic.sgrd -RESAMPLING=0 -KEEP_TYPE=1 -GRID=%od%\%pre%mosaicUTM.sgrd -UTM_ZONE=35 -UTM_SOUTH=0

:: Analytical Hillshading -
saga_cmd ta_lighting 0 -ELEVATION=%od%\%pre%Mosaic_reclassified.sgrd -SHADE=%od%\%pre%hillshade.sgrd

:: Sink Route -
saga_cmd ta_preprocessor 1 -ELEVATION=%od%\%pre%Mosaic_reclassified.sgrd -SINKROUTE=%od%\%pre%sinkroute.sgrd

:: Sink Removal -
saga_cmd ta_preprocessor 2 -DEM=%od%\%pre%Mosaic_reclassified.sgrd -SINKROUTE=%od%\%pre%sinkroute.sgrd -DEM_PREPROC=%od%\%pre%sinkfilled.sgrd

:: Flow Accumulation -
saga_cmd ta_hydrology 0 -ELEVATION=%od%\%pre%sinkfilled.sgrd -SINKROUTE=%od%\%pre%sinkroute.sgrd -FLOW=%od%\%pre%flowaccumulation.sgrd -METHOD=4

:: Channel Network -
saga_cmd ta_channels 0 -ELEVATION=%od%\%pre%sinkfilled.sgrd -CHNLNTWRK=%od%\%pre%channelnetwork.sgrd -CHNLROUTE=%od%\%pre%channelroute.sgrd -SHAPES=%od%\%pre%channelnetworktable -INIT_GRID=%od%\%pre%flowaccumulation.sgrd -INIT_VALUE=1000

::print a completion message so that uneasy users feel confident that the batch script has finished!
ECHO Processing Complete!
PAUSE
For a link to the downloadable text file of my ASTER batch sript, click here.
For a link to the downloadable text file of my SRTM script, click here.
Results and Discussion
In the following maps, the base layer hillshade and channel network maps provided are from ASTER data. Within each of the maps, there is a smaller map which annotates areas of error on the base layer ASTER map. These annotation maps are a result of subtracting the channel network outputs of SRTM from ASTER. In these annotation maps, red lines demonstrate locations in which ASTER data resulted in the presence of a stream feature when SRTM did not. Blue lines in the annotation maps are locations where SRTM input data resulted in the calculation of a stream in the channel network while ASTER data did not.
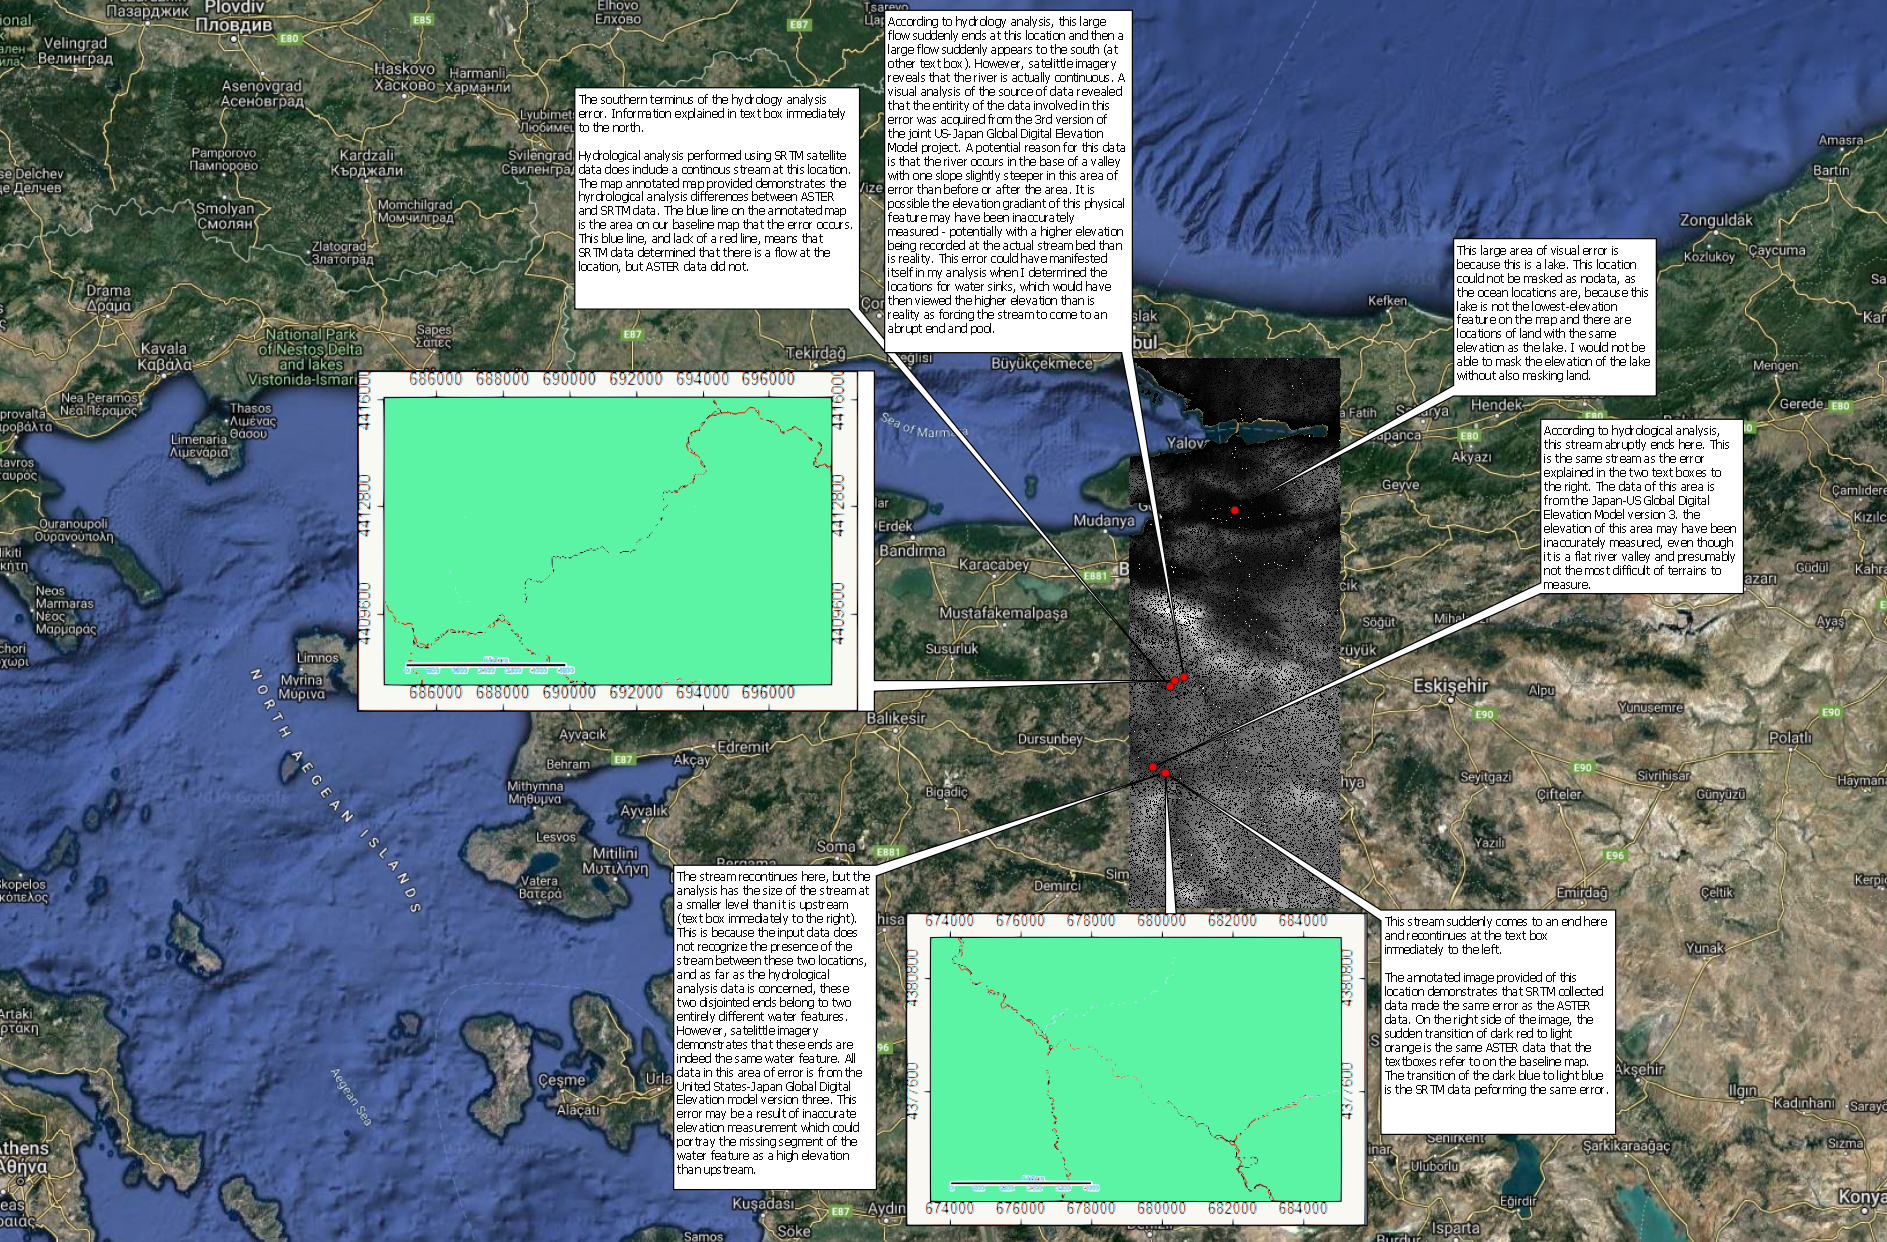
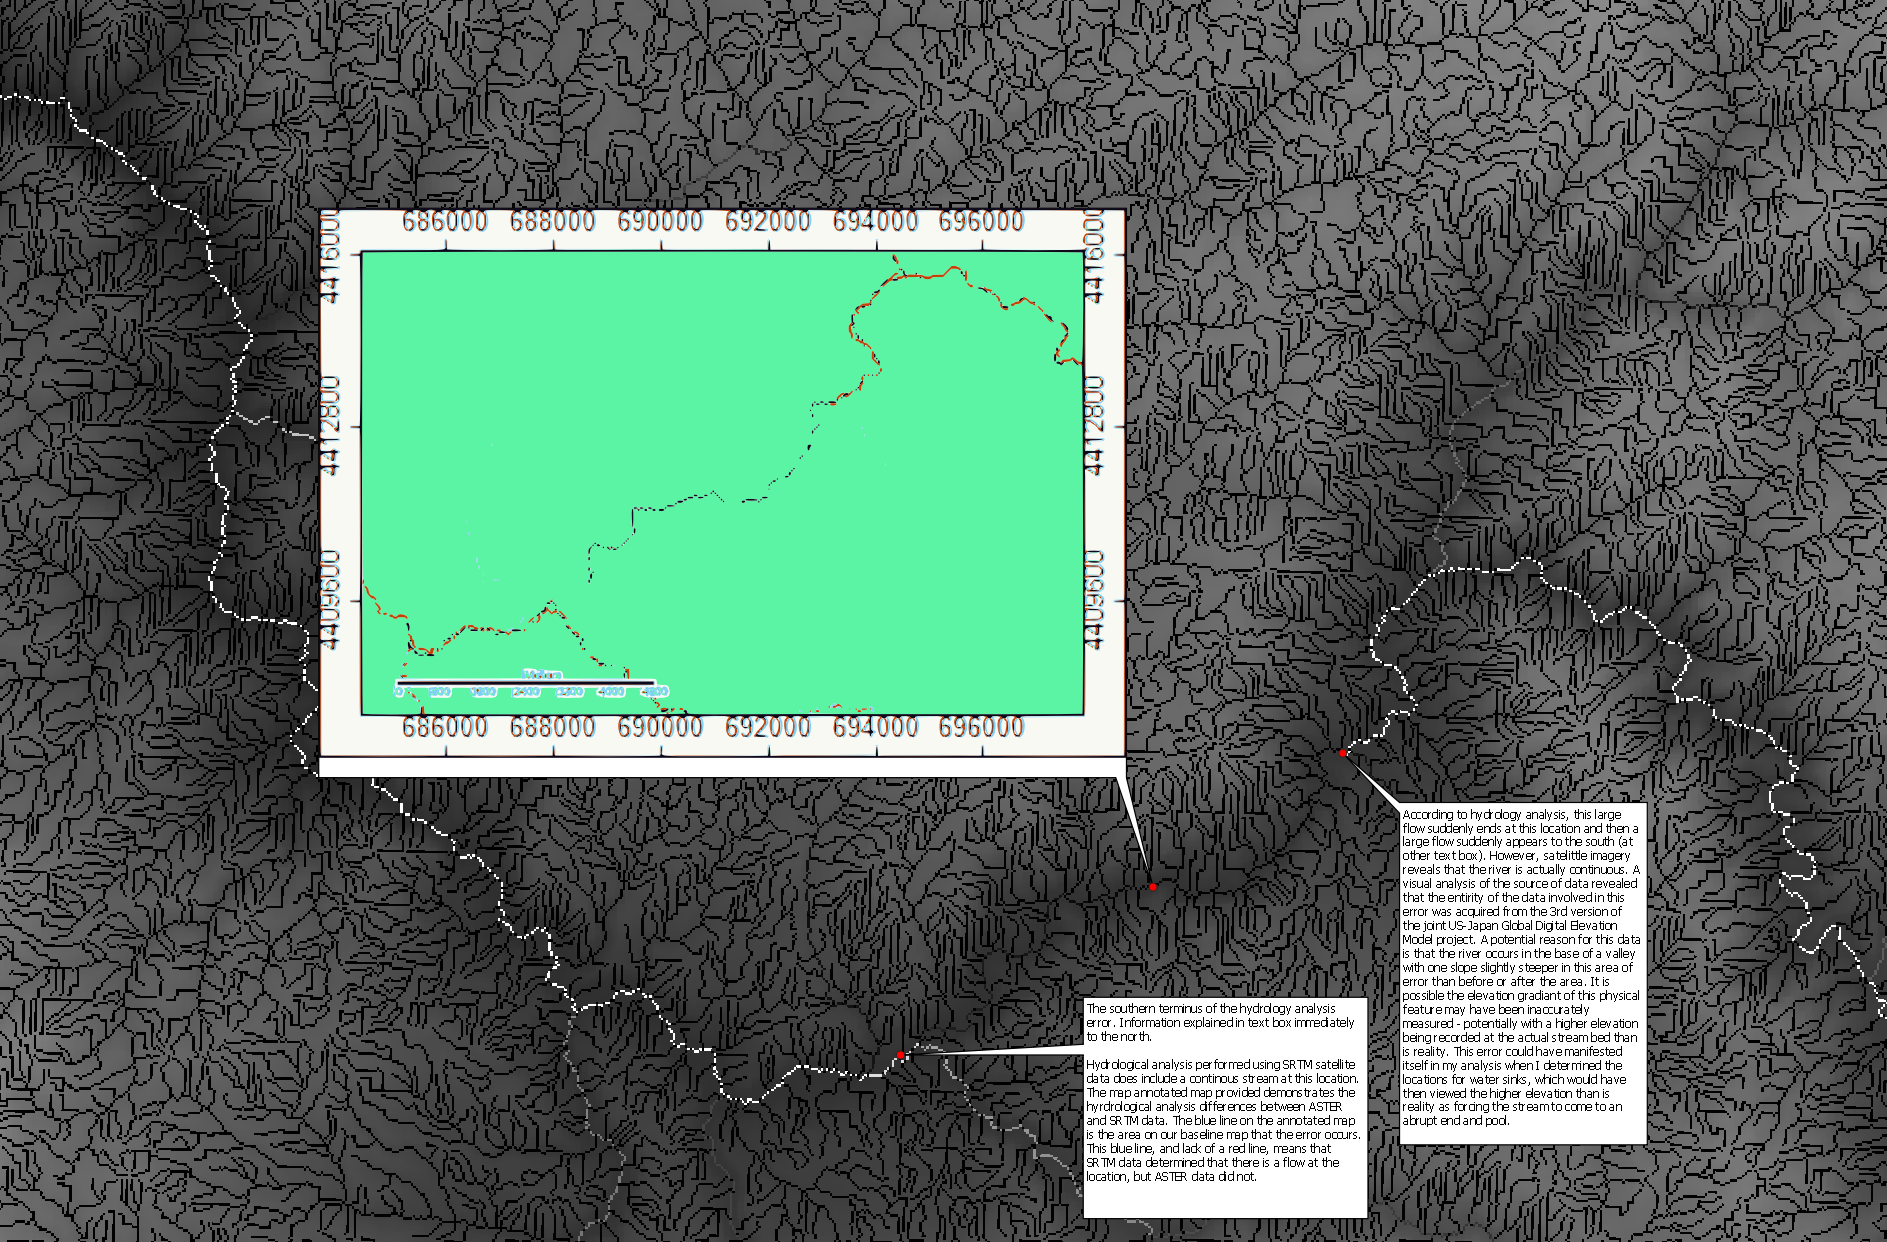
A closer look at the northern cluster of information.
A closer look at the southern cluster.
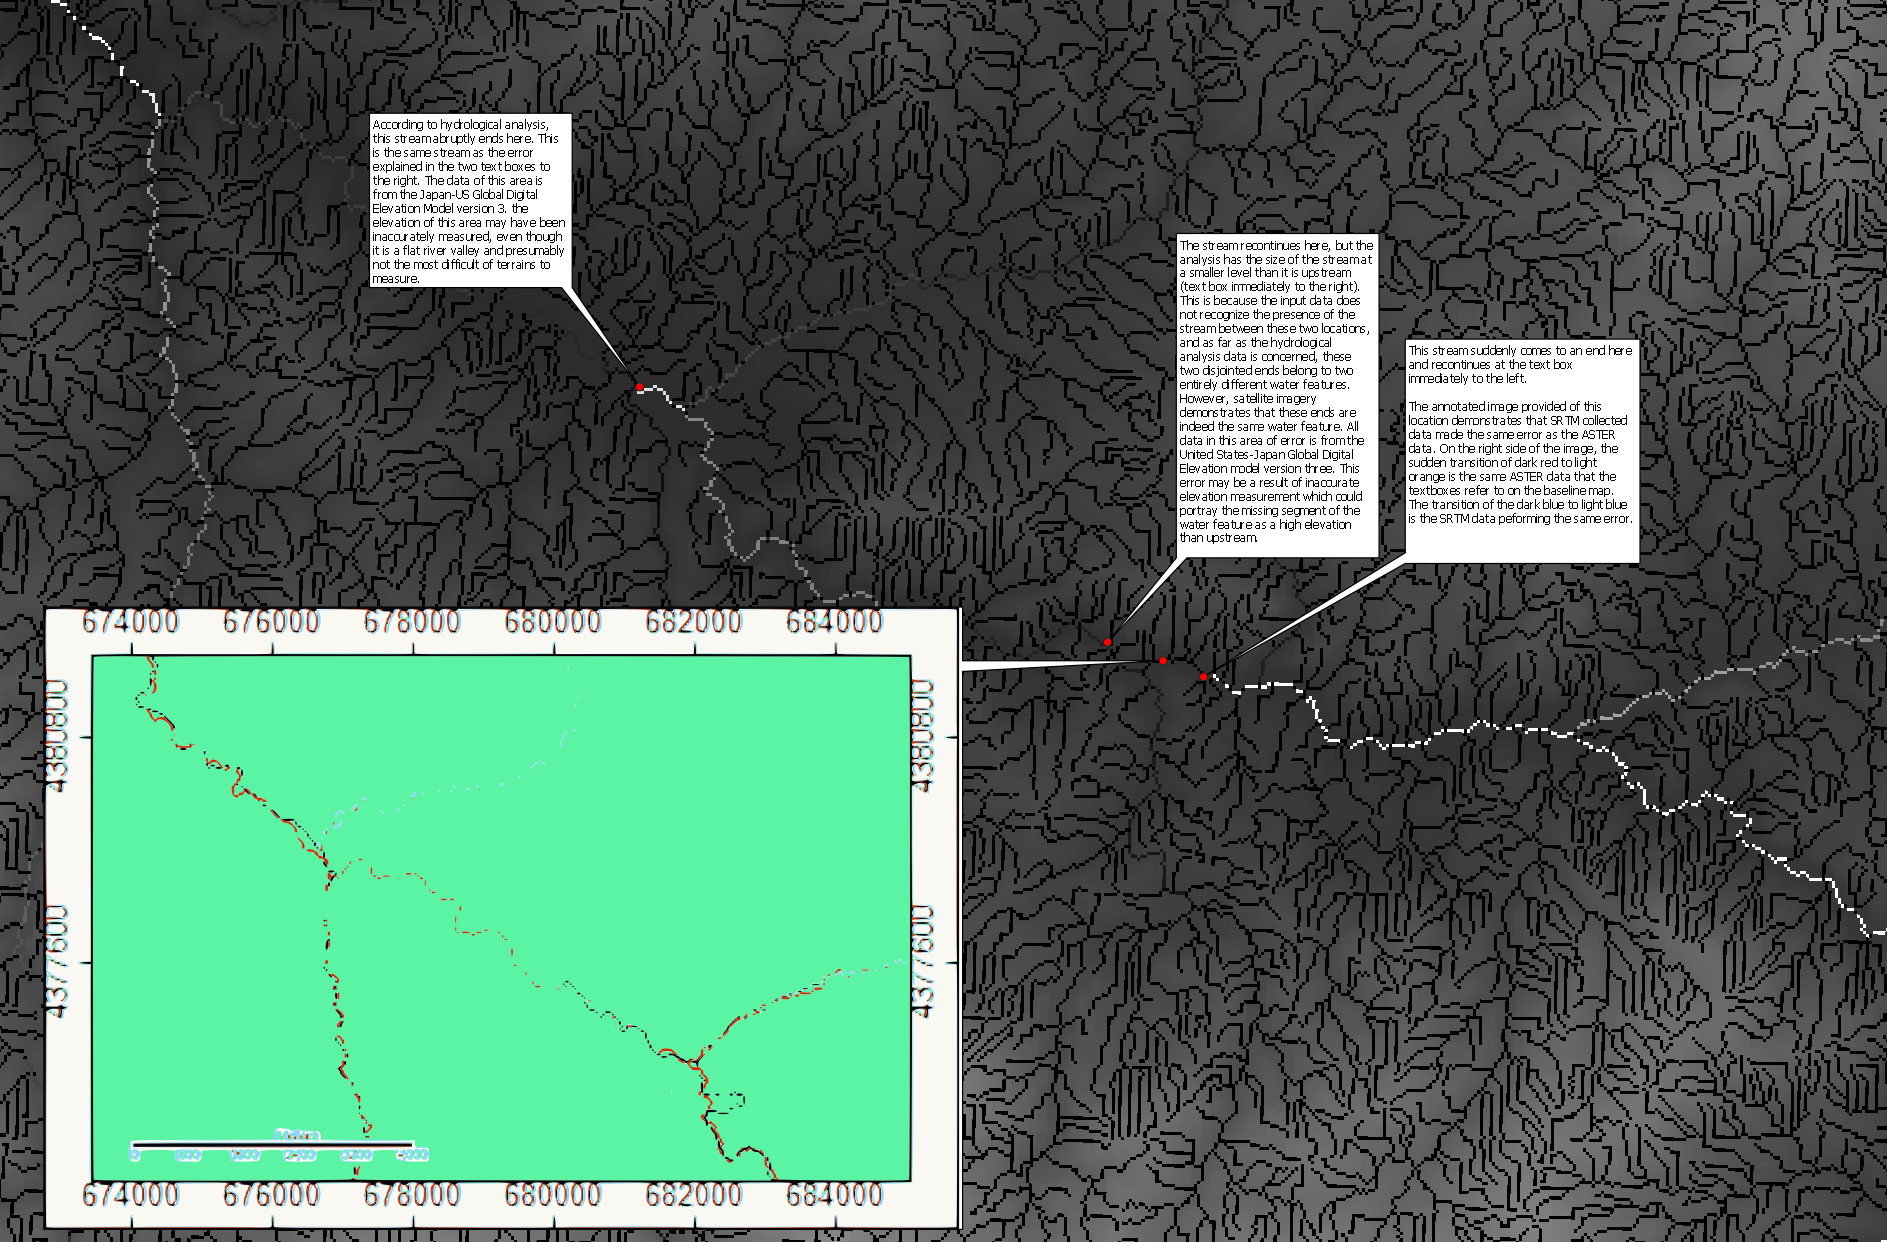
As discussed in some of the in-map text boxes, a possible reason for the error of disappearing stream channels could be a result of steep river channel valleys. In these locations, the radar beams used to measure the topography of the Earth’s surface are not able to penetrate to the bottom of the river valley. Rather, they only return elevation data from the banks of the river. Since there is then a gap in the continuum of data, the missing part which is in reality the bottom of the river bank is calculated through the interpolation of the nearest measured values. This can result in the data being filled in at a higher elevation than it truly is in reality. If the interpolated value between the river banks is a higher elevation than the accurately measured elevation of the river upstream, then as far as the data in concerned, the river stops at the moment the channel increases in elevation and a new river is formed.
Return to SAGA Index Page.
Return to Main Index Page.